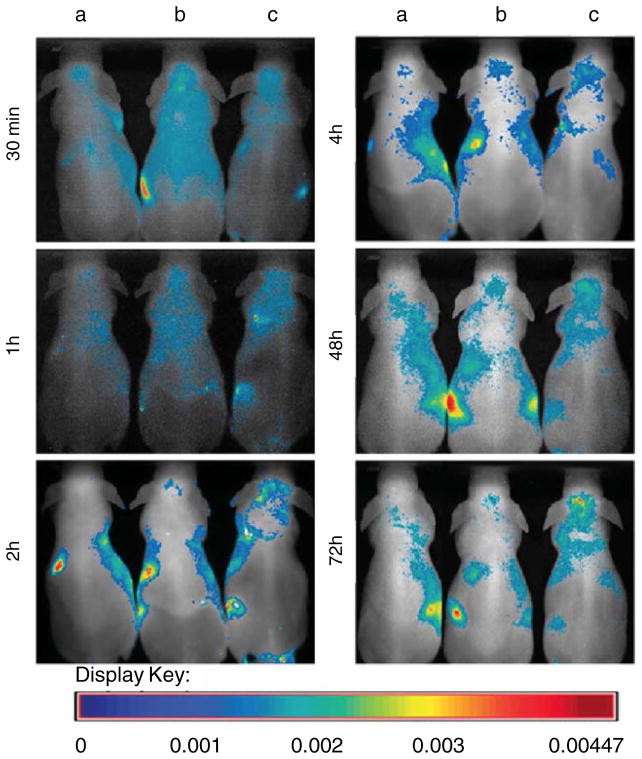
Fig. 3.
In vivo time-dependent fluorescence imaging of carboxylesterase expressing NSCs (F3.rCE). The mice were randomized into three groups: group A, sham-operated mice with i.v. injection of LEO-Live 675; group B, sham-operated mice with i.v. injection of LEO-Live 675-labeled F3.rCE; group C, subdural medulloblastoma-bearing mice with i.v. injection of LEO-Live 675-labeled F3.rCE cells. Fluorescence images of the mice were taken at the indicated times. In group C, F3.rCE cells migrate to the subdural tumor foci at 2 h and accumulate there over time. Signals from F3.rCE cells have gradually faded in other major organs. Adapted with permission from [29]

