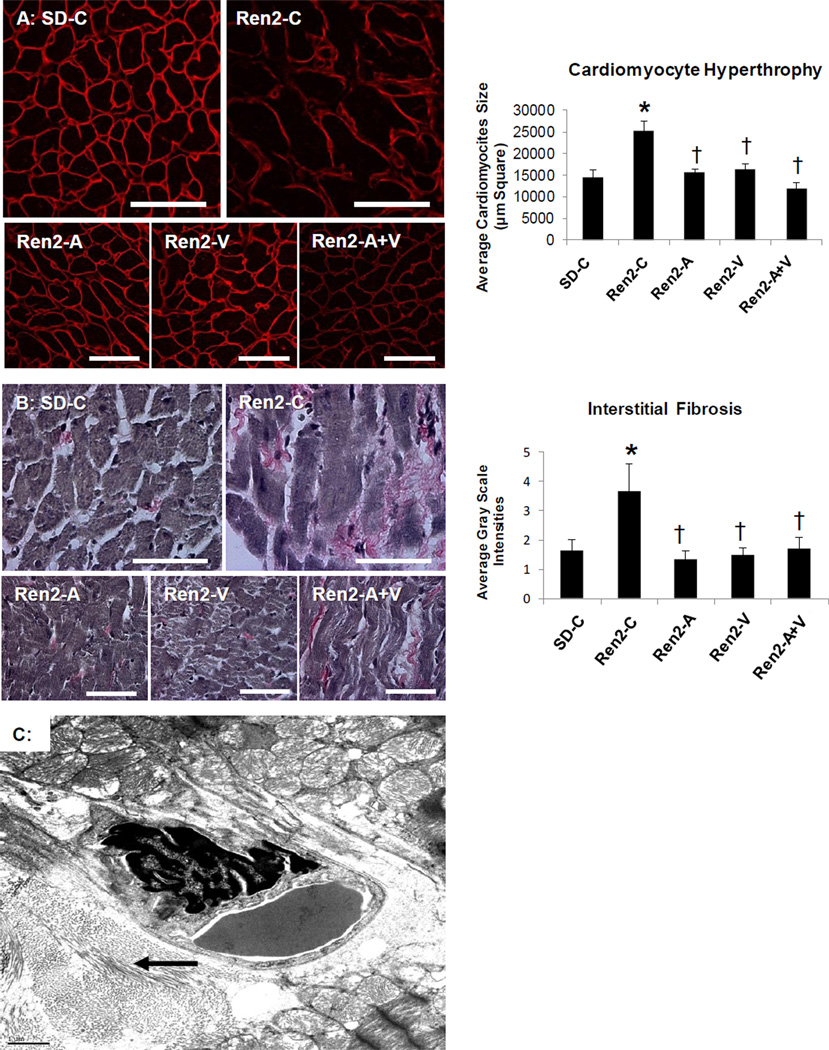
Figure 2. Markers of cardiac tissue hypertrophy and fibrosis in the Ren2 Rat.
A) Representative images of semi-quantitative analysis of heme-pomatia agglutinin with measured to the right. B) Verhoeff-Van Gieson (VVG) stain for elastin and collagen with measures of tubulointerstitial fibrosis to the right. Values presented as mean ± standard error. *, p<0.05 when Ren2 controls (Ren2-C) are compared to age-matched Sprague-Dawley controls (SD-C); †, p<0.05 when Ren2 rats treated with either aliskiren (Ren2-A), valsartan (Ren2-V), or combination (Ren2-A+V) are compared to age-matched Ren2-C. C) Ultrastructural analysis utilizing transmission electron microscopy of the Ren2 demonstrate organized fibrillar collagen in the interstitial and perivascular regions. This image demonstrates the marked pericapillary interstitial organized fibrillar collagen (arrow) typical of early ultrastructural fibrosis that appears asteroid-like shaped around a 4×6 µm interstitial capillary. Scale bar = 1 µm.

