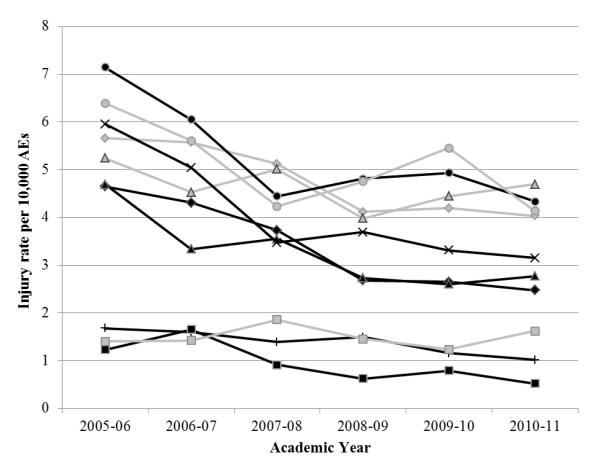
FIGURE 1A.
Rates of ankle sprains per 10,000 athlete exposures by sport in 9 sports, High School Sports-Related Injury Surveillance Study, United States, 2005/06–2010/11. a,b,c
◆ Total
 Football
▴ Boys’ Soccer
 Girls’ Soccer
× Girls’ Volleyball
• Boys’ Basketball
 Girls’ Basketball
+ Wrestling ∎ Baseball
 Softball
aReflects rates for combined original and convenience samples.
b“Total,” is the total rate for combined original and convenience sample data for only the original 9 sports.
cSignificant trends (see text): Total (p = 0.002), boys’ football (p = 0.006), boys’ soccer (p = 0.028), boys’ wrestling (p = 0.005), and girls’ volleyball (p = 0.015), and boys’ basketball (p = 0.041)

