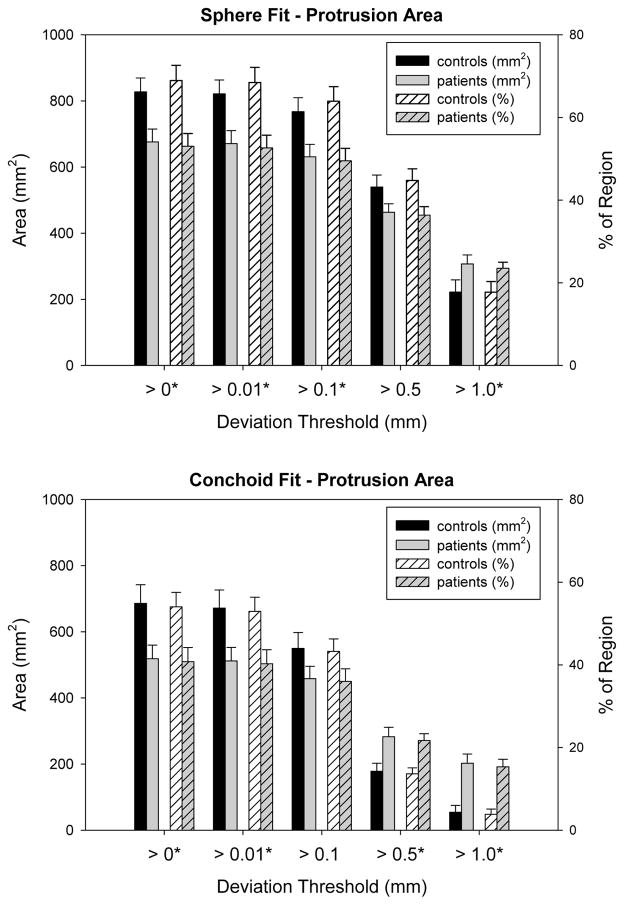
Figure 6.
Protrusion areas determined in the region of maximum deviation from spheres (top) and conchoids (bottom). Error bars indicate standard error. At lower deviation thresholds, protrusions for the control group had larger areas than those of the patients. However, at higher thresholds protrusions for the patients outsized those of the controls. Asterisks indicate thresholds at which areas were significantly different between control and cam-type FAI femurs.

