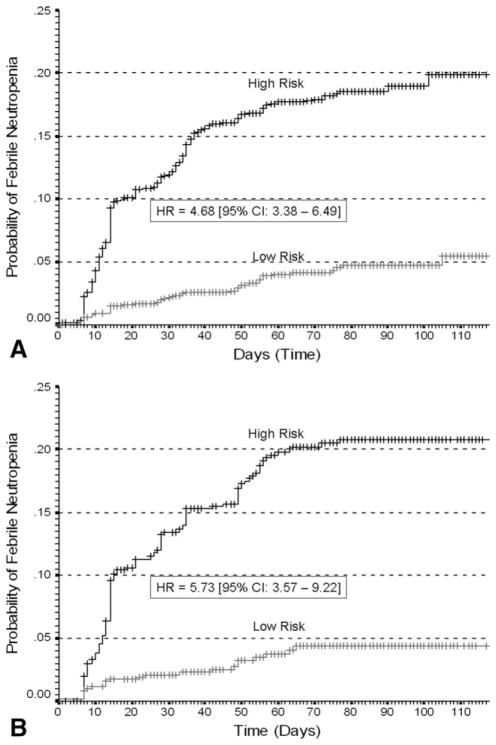
Figure 4.
(A) Kaplan-Meier plot displays the cumulative proportion of patients who experienced 1 or more episodes of febrile neutropenia over time in days after chemotherapy initiation for both high-risk and low-risk patients in the derivation population based on the risk model. (B) Kaplan-Meier plot displays the cumulative proportion of patients who experienced 1 or more episodes of febrile neutropenia over time in days after chemotherapy initiation for both high-risk and low-risk patients in the validation population based on the risk model.

