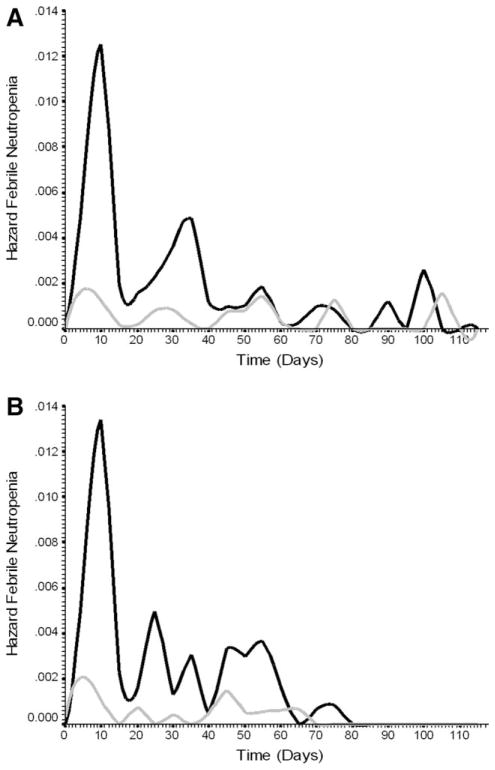
Figure 5.
(A) Hazard function plot displays the distribution of hazard rates for febrile neutropenia over time in days after chemotherapy initiation for both high-risk and low-risk patients in the derivation population based on the risk model. (B) Hazard function plot displays the distribution of hazard rates for febrile neutropenia over time in days after chemotherapy initiation for both high risk and low risk patients in the validation population based on the risk model.

