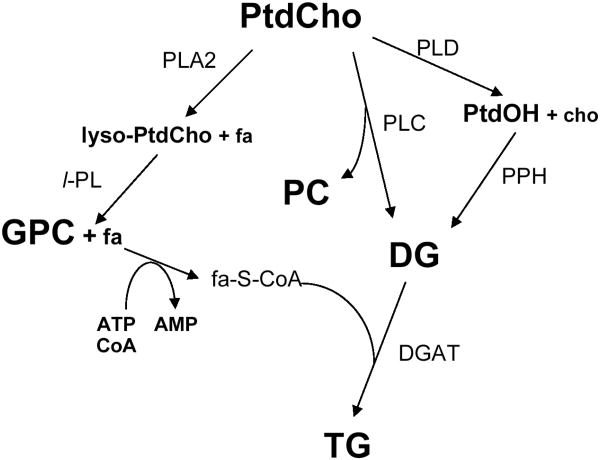
Figure 2.
Metabolic flow chart showing the phosphatidylcholine cycle of phospholipid metabolism and the pathways leading to the production of triglycerides. The final step in triglyceride synthesis occurs in the endoplasmic reticulum and is the condensation of an activated fatty acid (fa-S-CoA) with diacylglycerol (DG) via the enzyme diacylglycerolacyltransferase (DGAT). The flow chart shows other key pathways in phosphatidylcholine catabolism. Most notably, during cell stress the catabolic production of GPC arises from the consecutive removal of fatty acyl chains from phosphatidylcholine by phospholipase A2 and lysosphospholipase. The fatty acids released can be reesterified into phospholipids or converted into triglycerides. Enzymes: DGAT, diacylglycerolacyltransferase (E.C. 2.3.1.20); GPC-PDE, GPC-phosphodiesterase (E.C. 3.1.4.2); PLA2, phospholipase A2 (E.C. 3.1.1.4); l-PL, lysophospholipase (E.C. 3.1.1.5); PLC, phospholipase C (E.C. 3.1.4.3); PLD, phospholipase D (E.C. 3.1.4.4); PPH, phosphatidate phosphohydrolase (E.C. 3.1.3.4). Metabolites: cho, choline; DG, 1,2-diacylglycerol; PtdOH, phosphatidic acid, PC, phosphocholine, PtdCho, phosphatidylcholine; TG, triacylglycerol (triglycerides). Adapted from [46] and reprinted with permission.

