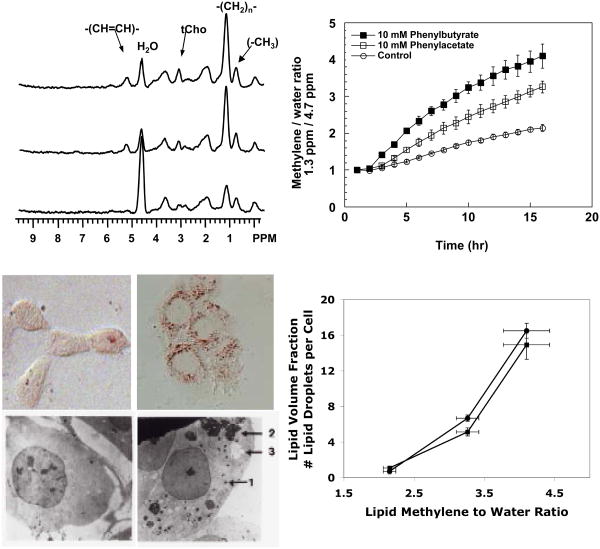
Figure 3.
Induction of MR-visible lipids by differentiating agents in prostate cancer cells. The upper left panel shows 1H MR spectra of DU145 cells grown on Biosilon beads and perfused in the magnet. From the top, the three traces are: treated with 10 mM PB for 16 h, treated with 10 mM phenylacetate for 16 h, control. The top right panel shows the relative increase of the methylene to water ratio (1.3 ppm / 4.7 ppm). The relative increase in MR-visible lipid is greater when cells are treated with PB compared to phenylacetate or control. The bottom left panel shows oil red O and electron micrographs of control cells (left) and cells treated with PB (right), demonstrating the increase in cytoplasmic lipid droplets that accompany drug treatment. The bottom right panel plots number of lipid droplets per cell (circles) and the cellular volume fraction occupied by lipid droplets (squares) as a function of the methylene to water ratio showing a linear relationship for both measures for control, phenylacetate and PB-treated cells. Adapted from [46] and [45] and reprinted with permission.

