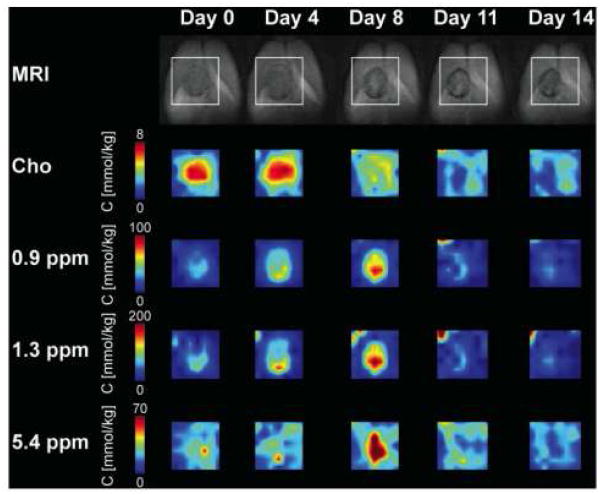
Figure 6.
MR images of a rat brain containing an HSV-tk positive BT4C glioma undergoing ganciclovir treatment. The top row shows T2-weighted coronal plane images with the region of interest for the CSI studies (box). The spatial change in tCho, mobile lipids (0.9 and 1.3 ppm) and PUFA (5.3 ppm) after treatment is shown by the CSI maps. An increase in mobile lipid concentration was observed for 8 days followed by reduction to baseline levels. This correlated with a decrease in tCho levels. Reprinted with permission from [89].

