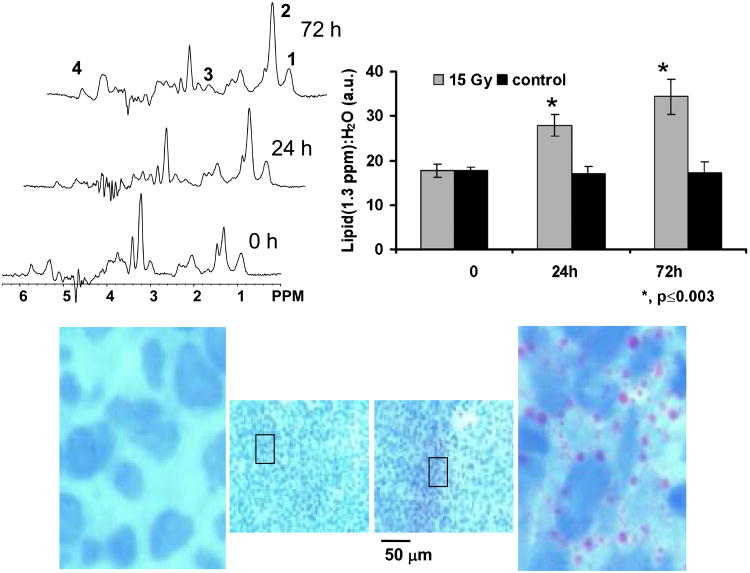
Figure 7.
Representative MR spectra and histological sections from a subcutaneously implanted human diffuse large B cell lymphoma xenograft showing changes in ML resonances after radiation therapy. (a) The top left panel shows spectra from a tumor before treatment and at 24 h and 72 h after 15 Gy irradiation. Labeled resonances are from: 1: lipid methyl (CH3 at 0.9 ppm); 2: methylene ((-CH2-)n at 1.3 ppm); 3: polyunsaturated fatty acid (-CH=CH-CH2-CH=CH- at 2.8 ppm) and 4: unsaturated fatty acids (-CH=CH- at 5.3 ppm). The ratio of the mobile lipid resonance at 1.3 ppm to unsuppressed water area (upper right panel) shows a significant increase in mobile lipids in treated tumors (grey bars) in comparison to untreated control tumors (black bars). The histological sections stained with hematoxylin and oil red O in the bottom panel shows the increase in perinuclear lipid droplets (red) after 72 h treatment (right) compared to controls (left). Adapted from [49] and reprinted with permission.

