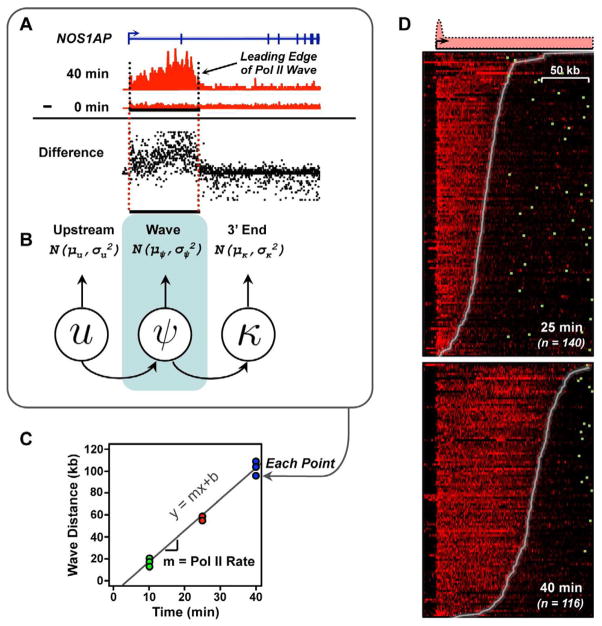
Figure 1. An approach for measuring rates of Pol II transcription using GRO-seq data.
(A and B) The Pol II wave was identified in GRO-seq data using a three state HMM applied to difference maps in each biological replicate.
(C) Pol II elongation rates were fit using linear regression.
(D) GRO-seq difference maps in the 25 and 40 min. E2 treatment conditions, versus untreated MCF-7 cells. Genes are ordered using the Pol II wave distance in each time point. Different numbers of genes reflect waves traveling past the end of the gene following 40 min. of treatment. Genes are aligned on the transcription start site; polyadenylation sites are denoted by green boxes.

