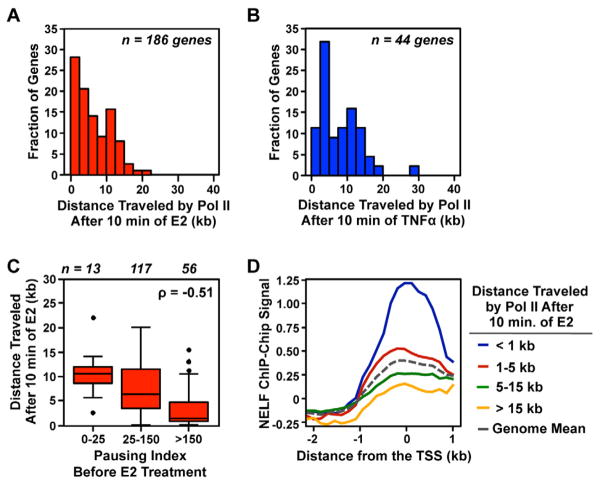
Figure 6. Pausing influences Pol II wave distance following a 10 min. treatment with E2, but not TNFα.
(A and B) Histograms show the distance travelled by Pol II following a 10 min. treatment with E2 (A) or TNFα (B).
(C) The pausing index of untreated MCF-7 cells compared to the distance traveled by Pol II following a 10 min. treatment with E2.
(D) Localization of NELF near the transcription start site of genes moving the distance indicated following 10 min. of E2.

