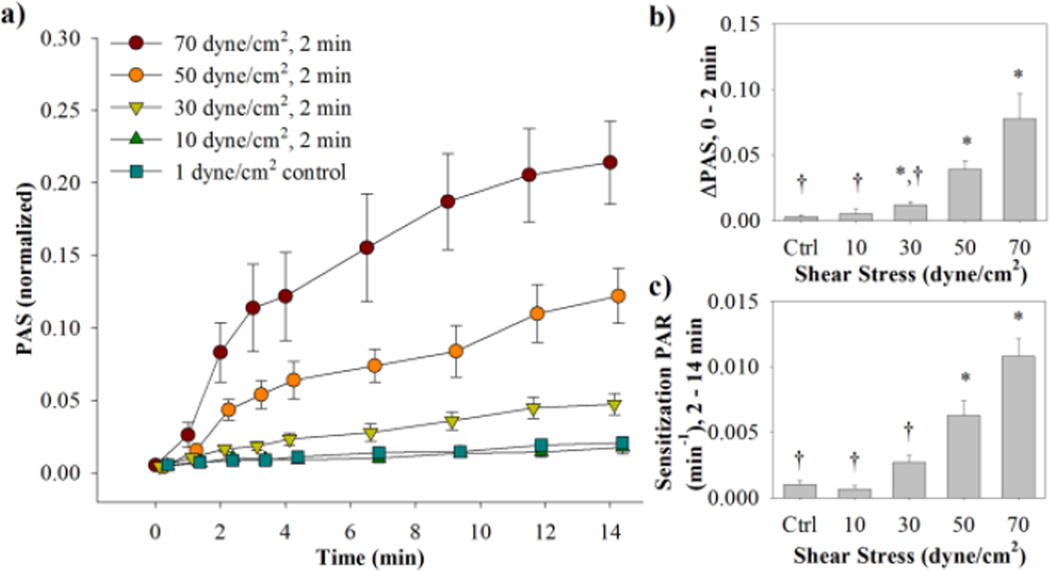
Figure 3. Variable magnitude waveforms PAS and PAR results.
(a) Normalized PAS results were obtained for both the high shear stress phase (0–2 min) and sensitization phase (2–14 min) (standard error bars, n = 9). (b) ΔPAS was measured over the high shear stress phase, while (c) PAR was measured for the sensitization phase (*p <0.05 vs. control, †p < 0.05 vs. 70 dyne/cm2).

