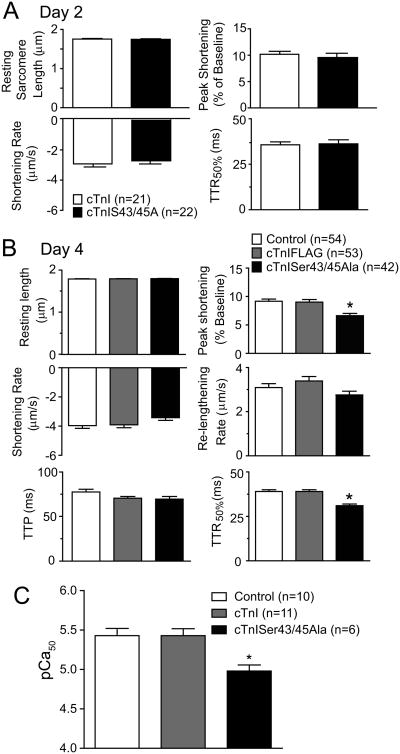
Figure 3. Cardiac myocyte contractile function 2 and 4 days after gene transfer of cTnI constructs.
A. Comparison of sarcomere shortening and re-lengthening measurements in control myocytes and myocytes expressing cTnISer43/45Ala 2 days after gene transfer. An unpaired Student's t-test indicated there were no significant differences between myocyte groups. In addition to these measurements, the time to peak (TTP), re-lengthening rate, and times to 25% and 75% re-lengthening also were not different between these 2 groups. B. Comparison of cardiac myocyte shortening and re-lengthening 4 days after gene transfer of cTnI and cTnISer43/45Ala. Results were compared using a one-way ANOVA and Newman-Keuls post-hoc test with p<0.05 (*) considered statistically significant from control values. Resting sarcomere length, shortening and re-lengthening rates and TTP were not different in control, and myocytes expressing cTnIFLAG, and cTnISer43/45Ala. The shortening amplitude decreased and there was an acceleration midway through re-lengthening (TTR50%) detected in myocytes expressing cTnISer43/456Ala. C. Quantification of pCa50 in control myocytes 4 days after gene transfer. Myofilament Ca2+ sensitivity was significantly reduced in Ser43/45Ala myocytes versus controls (Control 5.43±0.091, n=10, cTnI 5.43±0.088, n=11 and cTnISer43/45Ala-expressing myocytes 4.98±0.077, n=6). Statistical differences between the pCa50 values were identified using one-way ANOVA and Newman-Keuls post-hoc test with (*p<0.05) considered statistically significant.

