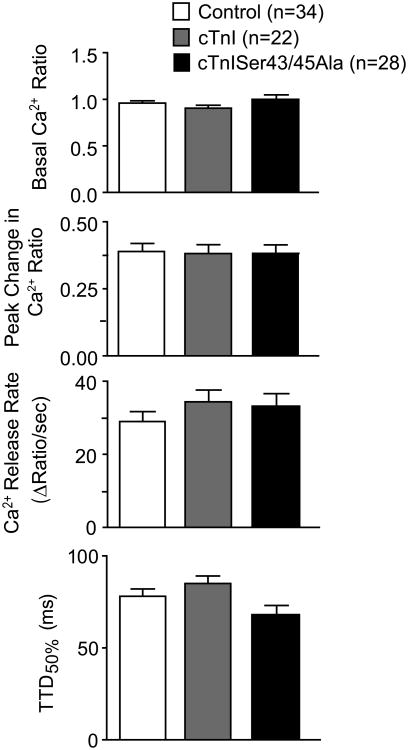
Figure 4. Comparison of Ca2+-transients in Fura-2AM loaded myocytes 4 days after gene transfer.
Basal and peak Ca2+ levels were similar in control, cTnI-, and cTnISer43/45Ala-expressing myocytes. The rates of Ca2+ release and decay also were similar among the 3 groups. There was a trend toward acceleration of Ca2+ decay, as indicated in the TTD50%, although a 1-way ANOVA indicated there was no statistically significant difference from control values (p>0.05).

