
Figure 6.
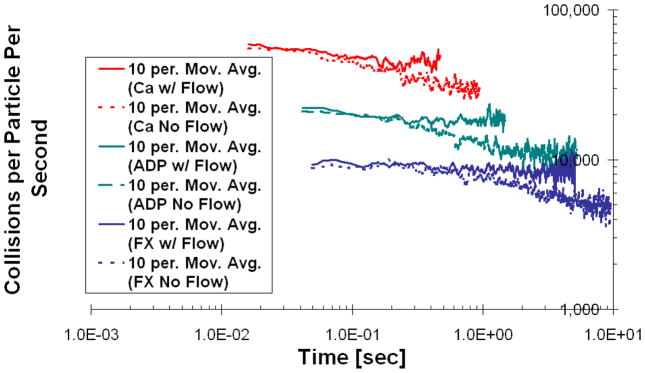
Average rate of collisions with the thrombus surface that each particle experiences after being released at the injury site, as a function of time and molecular weight. Data represented as moving average trend line with the number of periods equal to 10. Flow and no flow cases are presented for each tracer type.