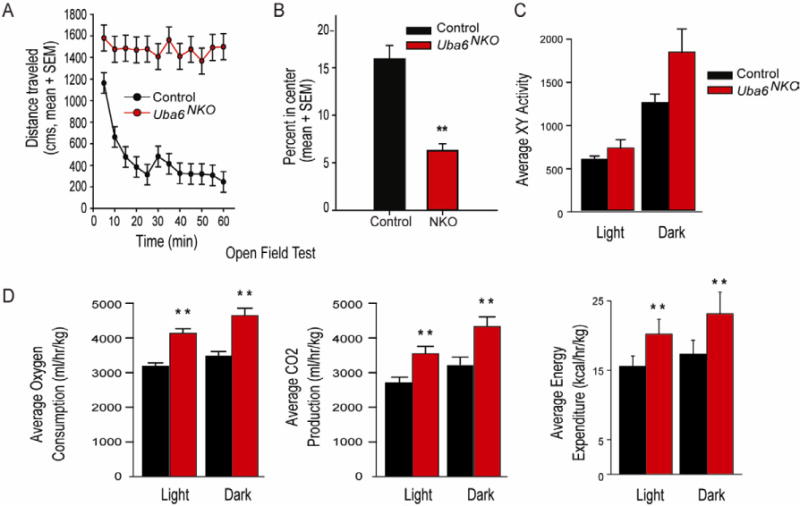
Figure 2. Behavioral analysis ofUba6NKOanimals reveals hyperactivity.

(A-B) Mice (female) were exposed to an open field arena for 60 min and distance traveled (A) and the time spent in the center (B) was recorded (mean ± SEM). Asterisks denote level of statistical significance (Student t test) between the control and Uba6NKO. **P < 0.01. Control (n=8) and Uba6NKO (n=6).
(C-D) Energy homeostasis analysis of control (Uba6Flox/Flox; n=6) and Uba6NKO (n=6) male mice analyzed for 48 h. (C) XY activity, (D) oxygen consumption, carbon dioxide production, and energy expenditure. All values are mean ± SEM. For complete data set, see Table S1. See also Figure S2, S3, and Supplemental Movie 1.
