
Figure 4. Uba6NKOmice display enhanced anxiety phenotypes and a decrease in dendritic spine density in the CA3 region of the hippocampus and the amygdala.
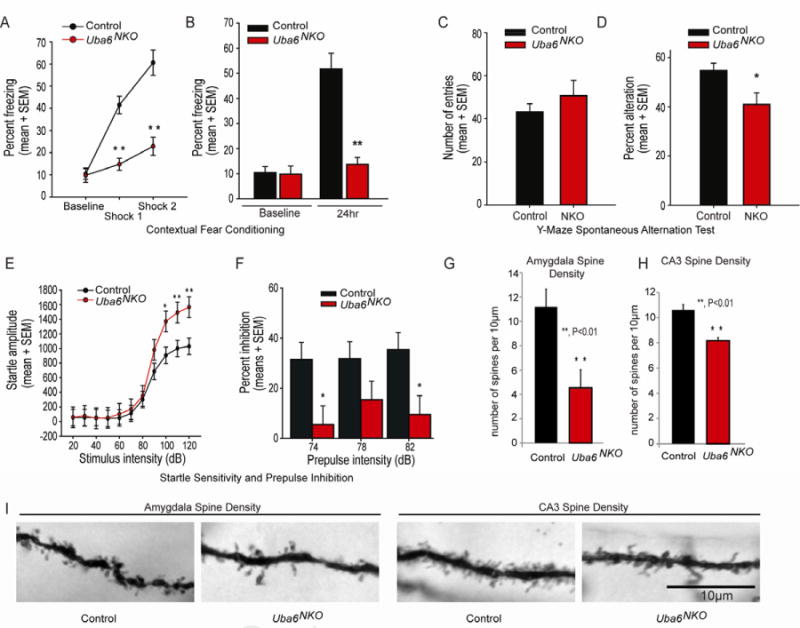
(A) Measurement of contextual fear conditioning expressed as percentage of total time spent freezing over each 1-min time bin. Mice were introduced to the novel conditioning chamber at t = 0, and a 2-second duration electric footshock was delivered at t = 2 min and t = 4 min. **P < 0.01. Control (n=8) and Uba6NKO (n=6).
(B) Retention of the contextual fear memory. The bars on the right represent the time spent freezing in response to the conditioned context 24 h following initial acquisition, in the absence of footshock. For comparison, baseline-freezing levels (recorded during the first two minutes of exposure to the novel context during training) are shown on the left. Error bars represents mean ± SEM and asterisks denote level of statistical significance (Student t test) between the control and Uba6NKO female mice. **P < 0.01. Control (n=8) and Uba6NKO (n=6).
(C-D) The average number of arm entries does not significantly differ between groups during the 6-min Y-maze session (C) while the average percent of spontaneous alternation is significantly decreased in Uba6NKO mice when compared with control and Uba6NKO mice (D). Error bars are mean ± SEM. *P < 0.05. Control (n=12) and Uba6NKO (n=9). Also see Figure S2 and Supplemental Movie 2.
(E-F) Uba6NKO mice exhibit impaired startle responses. Startle responses to eight presentations of the following sound pulses (presented in pseudorandom order): no stimulus, 20, 40, 60, 80, 100, and 120 dB pulse. For each pulse, the mean startle amplitudes were averaged (E). Pre-pulse inhibition measurements were performed in mice randomly exposed to five trial types: pulse alone (120 dB), three different prepulse/pulse pairings [prepulses at 74, 78, or 82 dB, followed by a 120 dB pulse with a 150-ms onset-onset interval], and no stimulus (F). Error bars are means ± SEMs (*, P < 0.05; and **, P < 0.01). Control (n=8) and Uba6NKO (n=6), all female).
(G-I) Reduced dendritic spines in neurons from amygdala (G) and the CA3 (H). The number of mushroom-shaped spines were determined per 10 μm in WT (n=4) and Uba6NKO mice (n=4). **P < 0.01. Error bars represent mean ± SEM. Seventy-five 10 μm sections were analyzed per mouse. Representative images are shown in (I).