
Figure 1. 3-D anatomical representation of reconstructed WM tracts and graphical representation of between group differences in FA, RD and LPH.
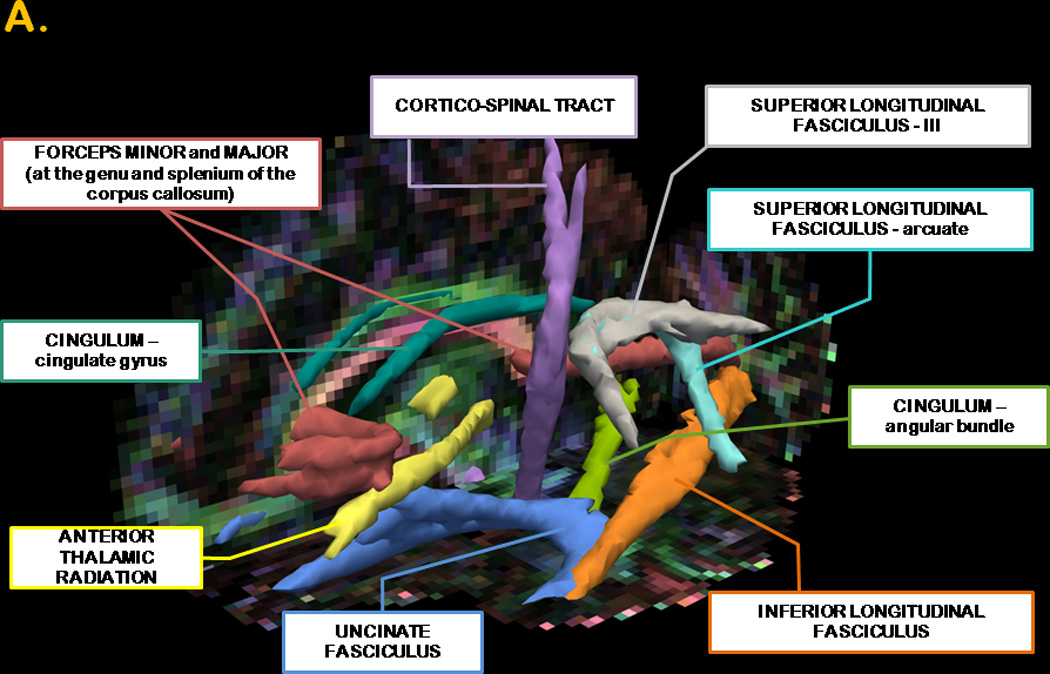
Panel A. The posterior distribution of each WM tract is displayed in isosurface mode. The forceps minor and major are represented in red; the anterior thalamic radiation in yellow, the angular bundle of the cingulum in light green; the cingulate gyrus of the cingulum in emerald green; the cortico-spinal tract in purple; the inferior longitudinal fasciculus in orange; the arcuate bundle of the superior longitudinal fasciculus in aquamarine; the III bundle of the superior longitudinal fasciculus in gray and uncinate fasciculus in blue. All fibers were thresholded at 20% of their maximum. The background image depicts the FA image in color-code convention in one of our participants: voxels with a red color define left-to-rightly oriented fibers; voxels with a blue color define inferior-to- superiorly oriented fibers and voxels with a green color define anterior-to-posteriorly oriented fibers. The isosurface superimposed on the sagittal view of the colored FA image shows the characteristic anterior-posterior alignment of the cingulum (green voxels) and the origin of the forceps minor and major (red voxels in the genu and splenium of the corpus callosum).
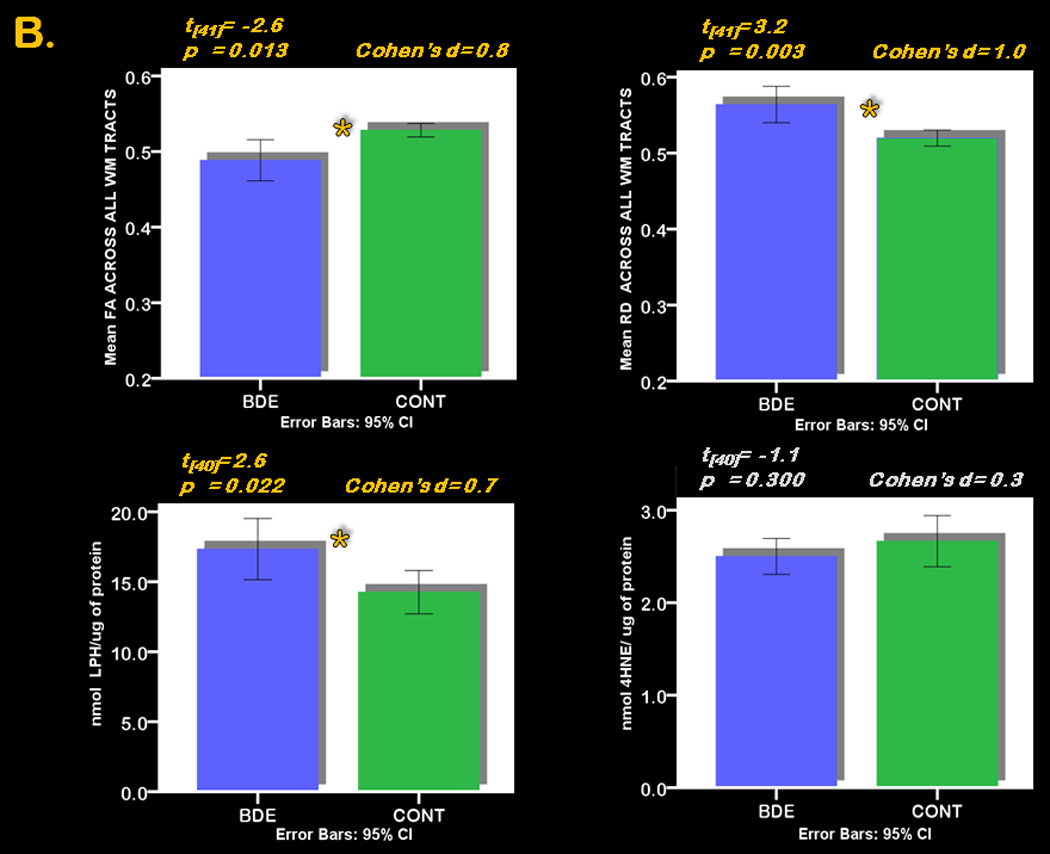
Panel B. Error-Bars graphs depict the between group differences in central measures (top; FA in the left corner and RD in the right corner) across all WM tracts, and in peripheral measures (bottom; LPH in the left corner and 4-HNE in the right corner) in 24 BDE and 19 CONT.
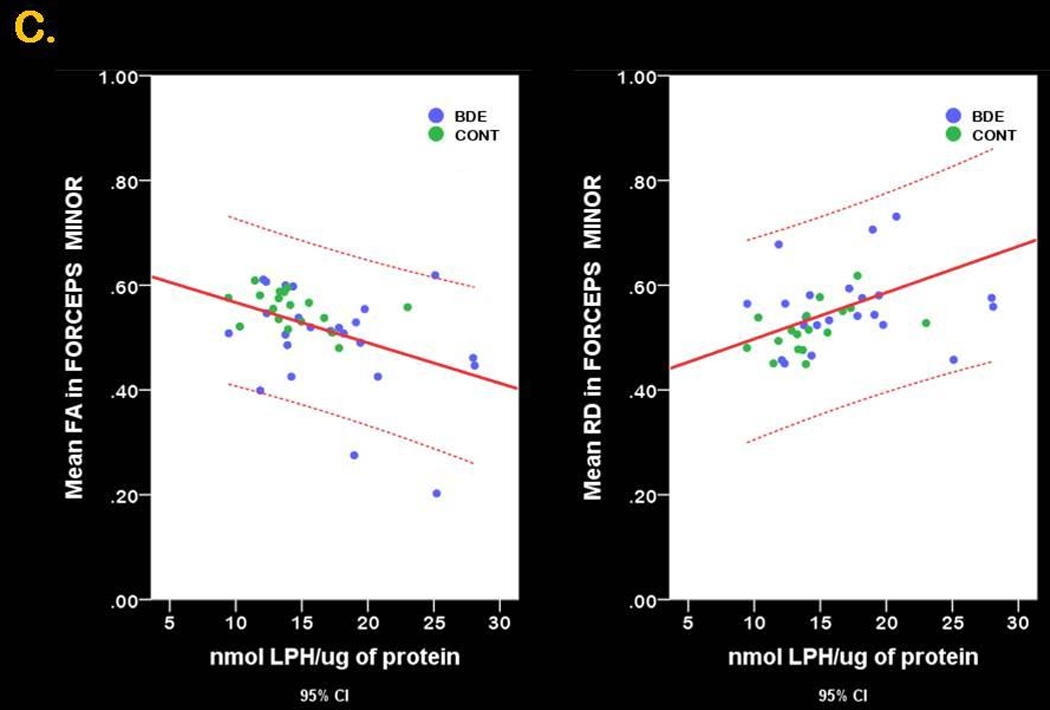
Panel C. Scatter plot graphs represent the linear relationship between mean FA (left) and mean RD (right) and LPH across all study participants in the forceps minor