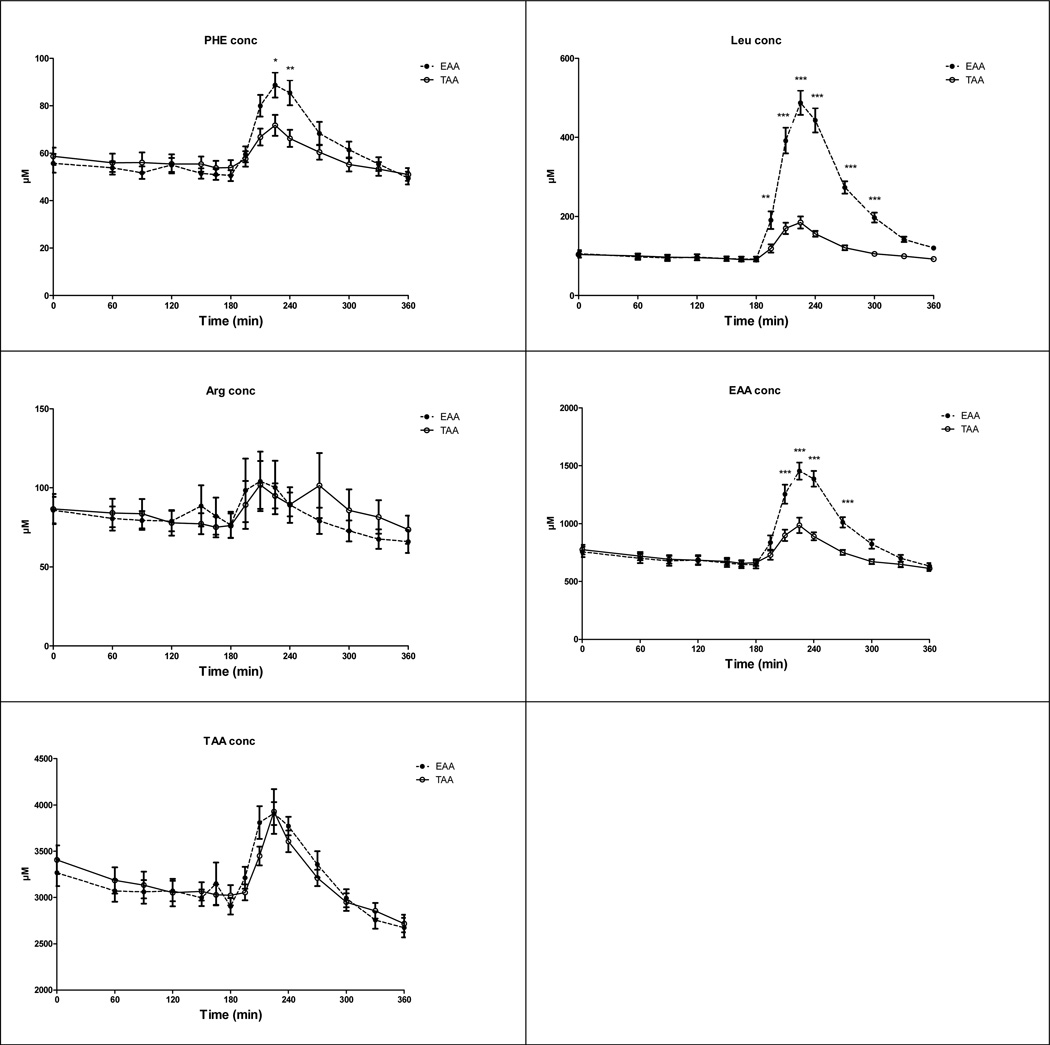
Fig 3.
Response in Phenylalanine (panel a), Leucine (panel b), Arginine (panel c), EAA (panel d) and TAA (panel e) concentration in the CF group before and after intake of the TAA and EAA mixture (t=180 min). Phenylalanine conc: Time (P<0.001) and Amino acid mixture effect (P<0.05), Time by Amino acid mixture interaction (P<0.01); Leucine conc: Time and Amino acid mixture effect (P<0.001), and Time by Amino acid mixture interaction (P<0.001); EAA conc: Time and Amino acid mixture effect (P<0.001), and Time by Amino acid mixture interaction (P<0.001); TAA conc: Time effect (P<0.001). Significance of difference between the EAA and TAA mixture: *: P<0.05; **: P<0.01; ***: P<0.001

