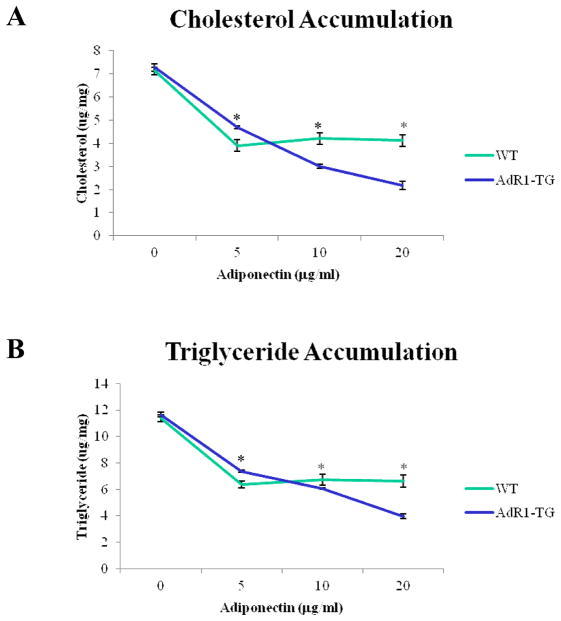
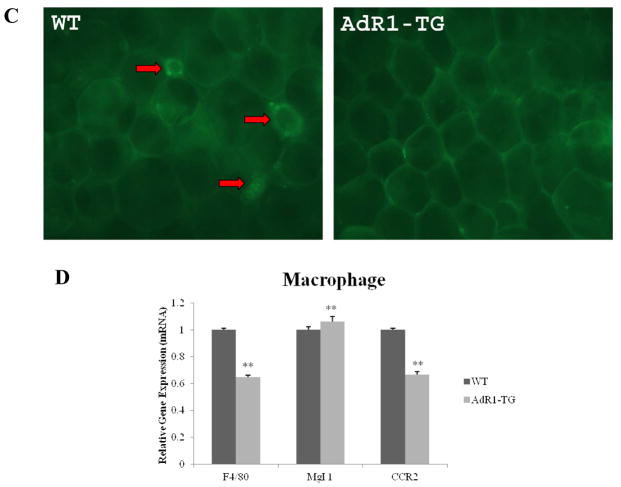
Fig. 3. Changes of lipid accumulation and macrophage markers in macrophages.
(A and B) Mouse macrophages from 20-week-old control wild-type (WT) and transgenic (AdR1-TG) mice fed the high fat diet were isolated and cultured for one week under different concentrations of adiponectin (0 to 20 μg/ml) and 100 μg/ml of oxLDL. Cellular accumulation of cholesterol and triglyceride was assessed in the WT and AdR1-TG macrophages using enzymatic colorimetric kits from Wako Company. Cellular lipid mass was normalized using cellular protein levels which were determined using a protein analysis kit from the Bio-Rad. (C) Mouse visceral fat tissue masses were isolated and hybridized with a macrophage-specific F4/80 antibody and a fluorescence-labeled second antibody and then subjected to a confocal microscope analysis as described in Methods section. The red arrows pointed to macrophages with the crown-like structures in the adipose tissues from control WT mice. (D) Total RNA was isolated from mouse macrophages and then cDNAs were synthesized. QPCR was performed with F4/80, Mgl 1 and CCR2 gene primers. Mean ± SEM from three separate experiments with triplicate samples (n=9 for each group) were examined, **p < 0.01.


