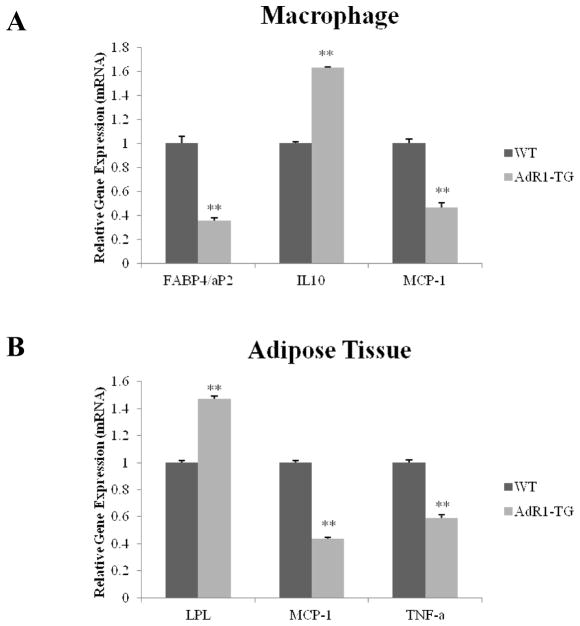
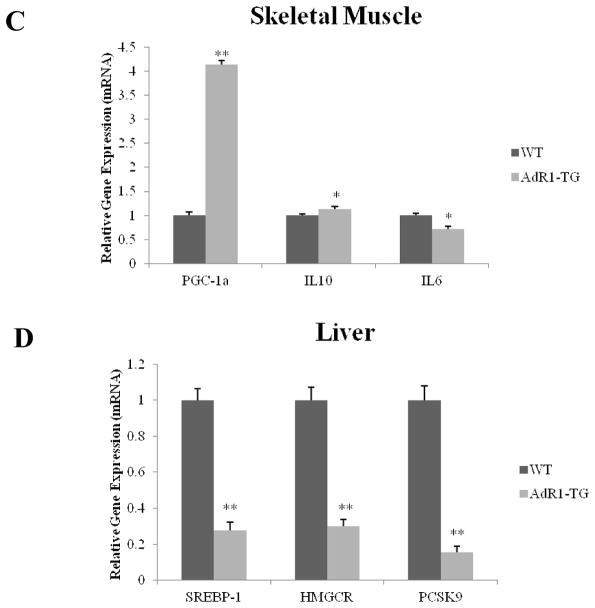
Fig. 7. Levels of expression of metabolic genes in mouse tissues.
Control wild-type (WT) and adiponectin receptor transgenic (AdR1-TG) mice were fed with the high fat diet for 20 weeks; and (A) macrophage, (B) adipose tissue, (C) skeletal muscle, and (D) liver were dissected. Total RNA was isolated from these cells/tissues, cDNAs were synthesized, and QPCR was performed with aP2, IL10, and MCP-1 gene primers for macrophages; LPL, MCP-1, and TNF-α for adipose tissue; PGC-1α, IL10, and IL6 for skeletal muscle; and SREBP1, HMGCR, and PCSK9 for liver. Mean ± SEM from three separate experiments with triplicate samples (n=9 for each group) were presented, *p < 0.05 and **p < 0.01.


