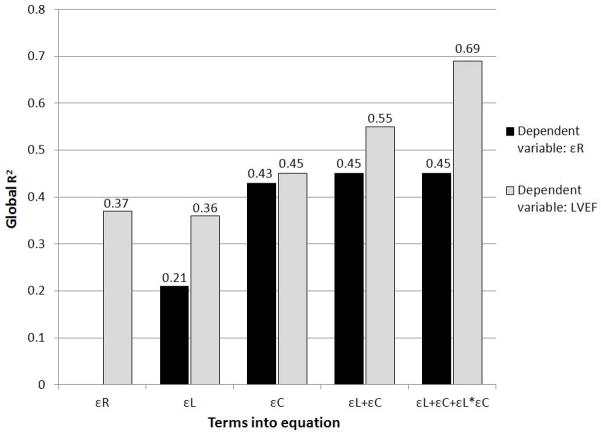
Fig. 2.
R-square values for linear models predicting εR and LVEF. On the x-axis are shown the independent variables included in each model: εR in the first model, εL in the second model, εC in the third model, εL and εC in the fourth model, εL and εC plus their interaction (εL*εC) in the fifth model.

