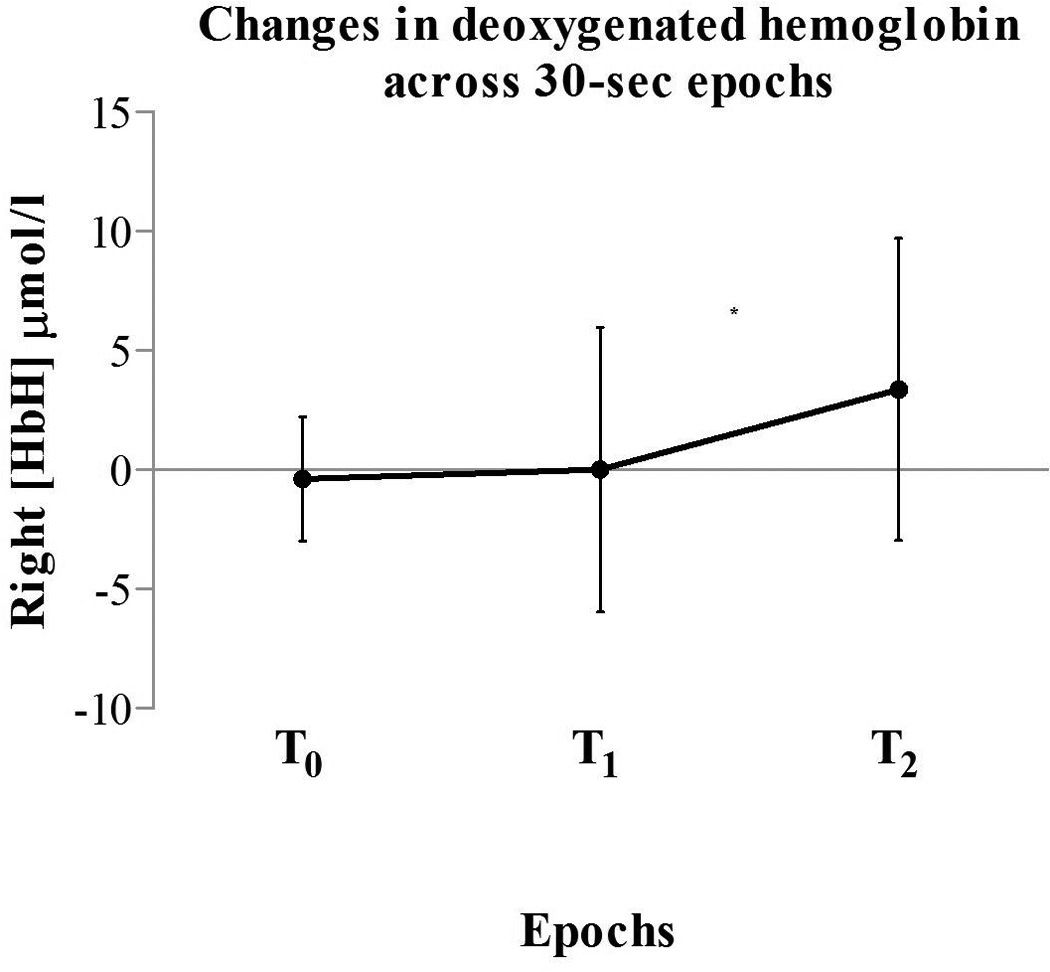
Figure 1.

Changes in right hemisphere [HbH] values in all subjects (n = 19). The figure shows significant [HbH] increases from baseline (T0) to noxious stimulation (T2) *p < 0.05. Vertical bars denote the standard deviations and the middle points denote the mean values.
T0: baseline; T1: tactile stimulation; T2: noxious stimulation.
