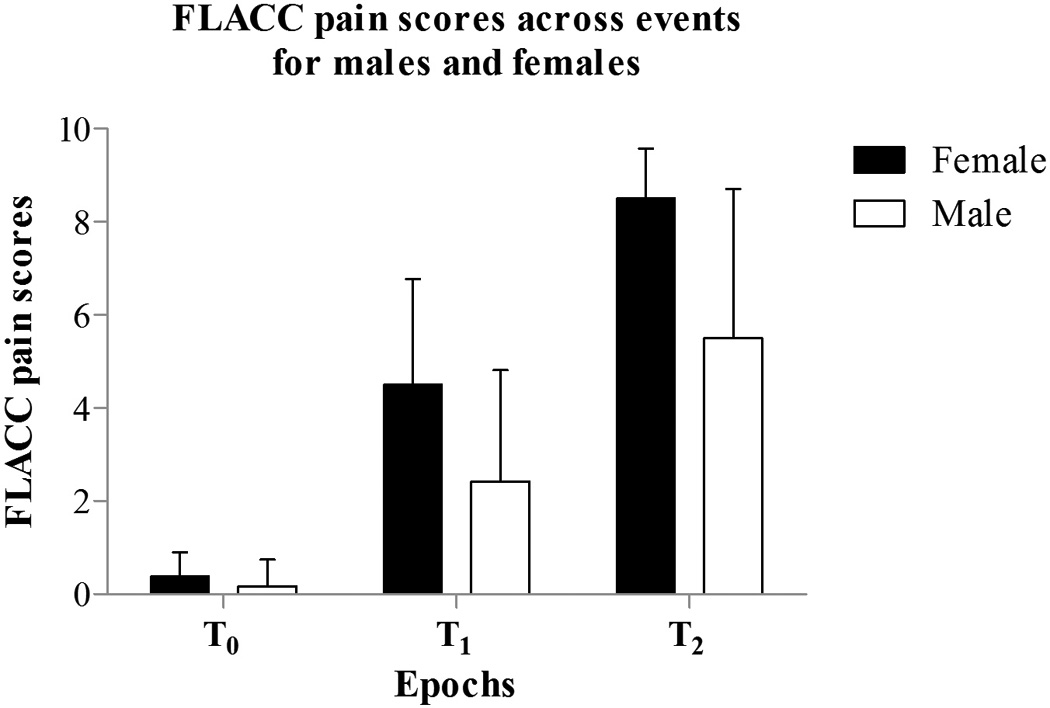
Figure 2.

Mean FLACC pain scores for baseline (T0), tactile (T1), and noxious (T2) events between males (n = 12) and females (n = 8). The figure shows significant differences in overall FLACC scores across the three events (p < 0.001) and between males and females (p < 0.01).
