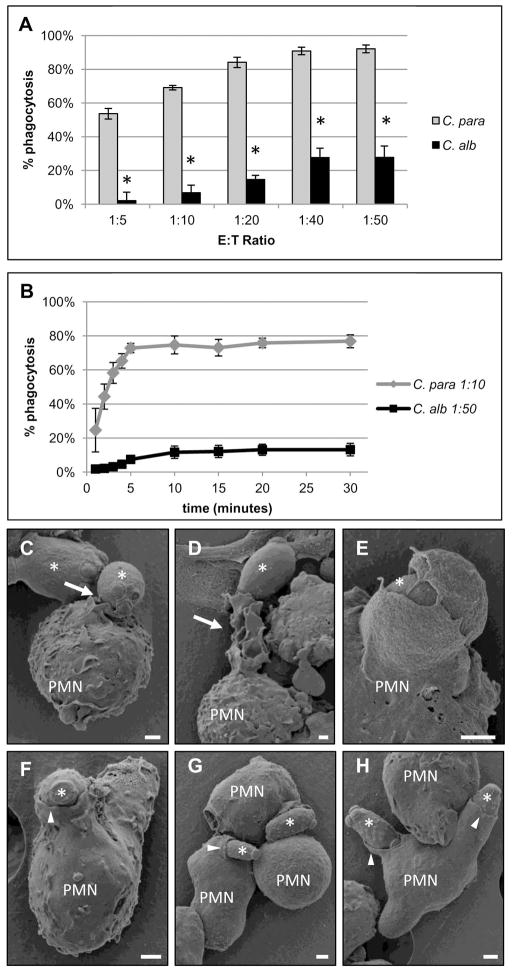
Figure 1. Neutrophils have different phagocytic responses to C. parapsilosis compared to C. albicans yeast.
Results are mean ± SEM of at least three different neutrophil donors. (A) Neutrophil phagocytosis rates of C. parapsilosis (C. para) and C. albicans (C. alb) yeast at various effector to target (E:T) ratios. * p ≤ 0.05 comparing C. para and C. alb at that E:T ratio. % phagocytosis was calculated by dividing the number of neutrophils with internalized yeast by the total number of neutrophils. (B) Neutrophil phagocytosis rates of C. parapsilosis (C. para) at an E:T ratio of 1:10 or C. albicans (C. alb) at an E:T ratio of 1:50 at indicated time points. (C–H) Scanning electron microscopy (SEM) photomicrographs of fixed neutrophils after 10 min of incubation with C. albicans (C–E) or 2.5 min of incubation with C. parapsilosis (F–H). Selected neutrophils are labeled (PMN) and yeast are indicated by asterisks. White arrows indicate neutrophil membrane ruffling and pseudopodia extending towards C. albicans yeast. White arrow heads indicate neutrophil membranes smoothly advancing over C. parapsilosis yeast. Bar = 1 micron.

