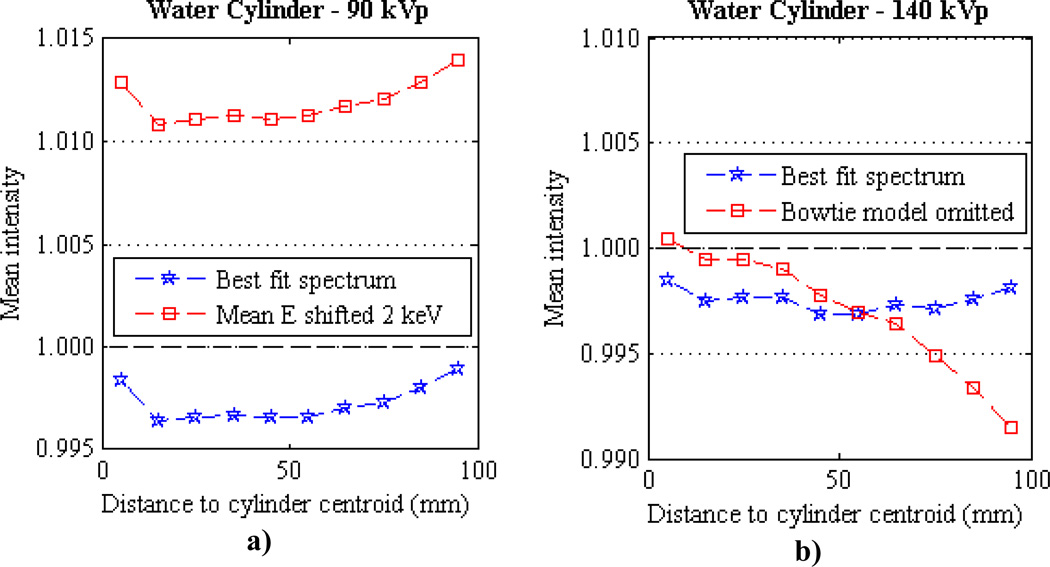
Figure 11.
Mean radial profiles for centered water cylinders reconstructed using spectra with intentional errors. (a) Water cylinder reconstructed with a 90 kVp spectrum with mean energy shifted +1.9 keV from the best fit spectrum. (b) Water cylinder reconstructed with a 140 kVp spectrum in which the bowtie filter model was not included, i.e., the central axis best fit spectrum was assumed for all off axis detectors. Each plot also contains the mean profile reconstructed using the best fit Birch-Marshall spectrum for comparison.

