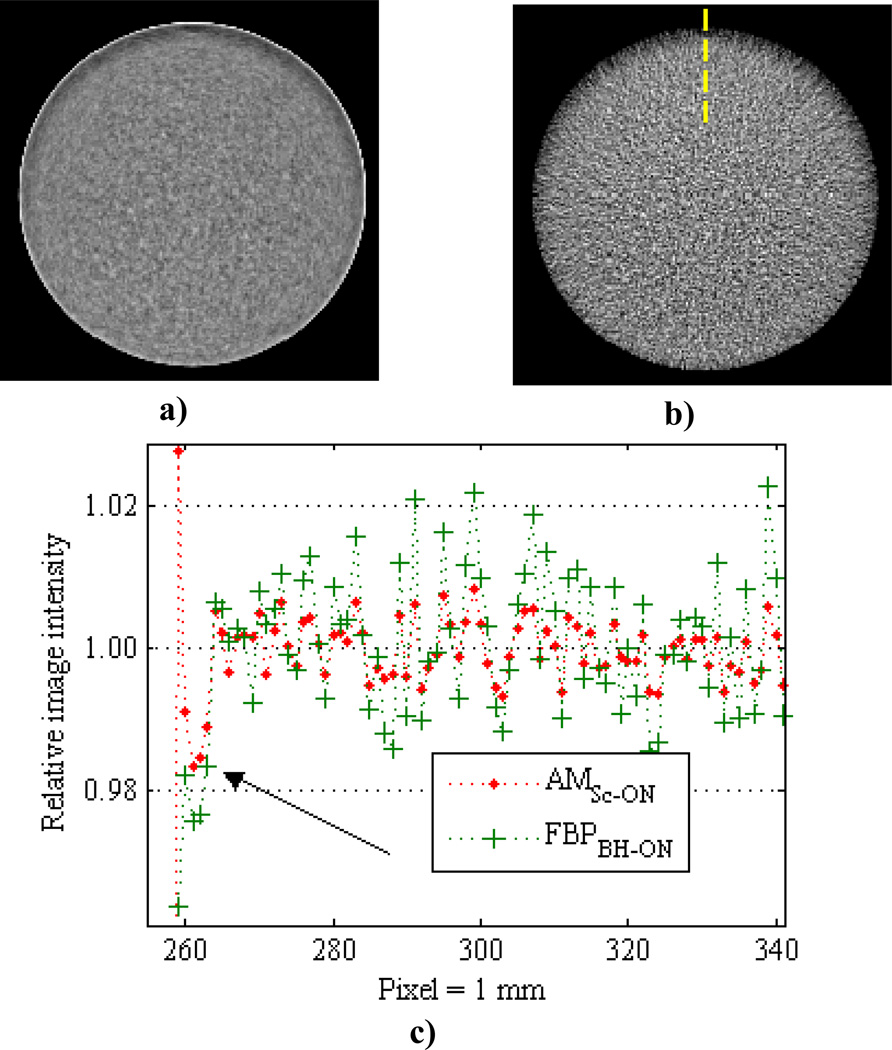
Figure 12.
140 kVp images of the 15.9 cm PMMA cylinder shifted ~ 9 cm down in the FOV reconstructed with AMSc-ON and (b) FBPBH-ON illustrate the proximal edge depression. Images are displayed with a narrow window of ± 3% around the centermost radial bin mean. (c) Vertical line profiles through the images [location shown by dashed line in (b)] normalized to the centermost radial bin mean. The proximal edge depression is observed in all off-centered cylinder reconstructions, i.e. all algorithms, all materials, all object sizes, and all tube potentials.

