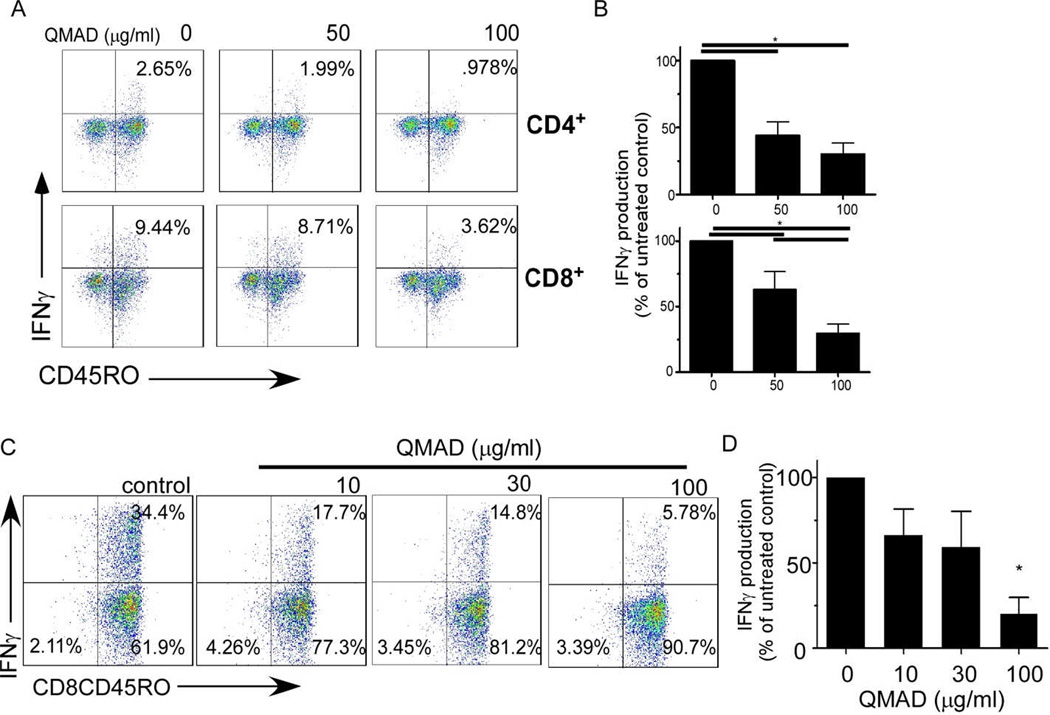
Fig. 6. QMAD inhibits IFNγ production by memory T cells.
(A) Representative flow cytometry plots of IFNγ production by CD45RO+ CD4+ (top) or CD8+ (bottom) T cells from 48-hr cultures of PBMC from a single donor stimulated with allogeneic B cells ± QMAD. PMA added 4 hours prior to cell harvest. (B) Quantification results, means ± SEM, n=11. (C) Representative flow cytometry plot of enriched CD8+CD45RO+ cells cultured ± QMAD for 48 hours with PMA added 4 hours prior to cell harvest. (D) Bars represent means (± SEM) of 3 experiments performed in triplicate. All quantified values expressed as % of untreated control, normalized to 100%. *p<0.05.

