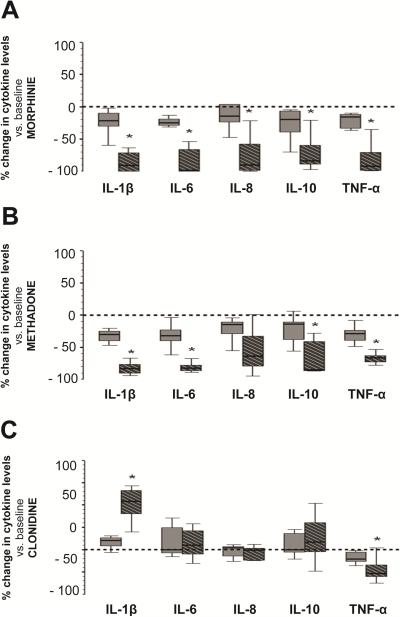
Figure 3.
Percent change in cytokine levels in supernatants of cultured blood cells from preterm infants following exposure to morphine (A), methadone (B), and clonidine (C). Concentrations included 10-5 M (dark grey) and 10-3 M (hashed-black). Changes represented as box-and-whisker plot, with boxes representing IQR and median (solid line in boxes). Reference line at 0 represents baseline condition (0 M). *, p≤0.01 (vs. baseline, Wilcoxon rank test); n=7.

