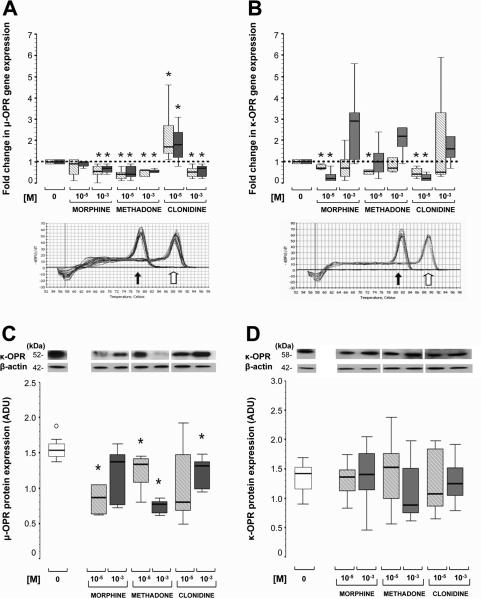
Figure 4.
Fold change in μ- (A), and κ- (B) OPR gene expression in MNC from preterm (hashed-white) and full-term (grey) infants in response to morphine, methadone, and clonidine at 10-5M and 10-3M. Protein expression of μ- (C) and κ- (D) OPR in MNC from full-term infants to similar treatments at 10-5M (hashed-grey) and 10-3M (dark grey). Changes represented as box-and-whisker plot, with boxes representing IQR and median (solid line in boxes). For gene expression (A and B), reference line at 1 represents gene expression at baseline condition (0 M) and melting curves identified a single PCR product for each OPR (block arrow) along with GAPDH (housekeeping gene, white arrow). For protein expression (C and D), representative 15% SDS-PAGE immunoblots for respective OPRs with β-actin loading controls are also presented. *, p< 0.05 (vs. baseline, Wilcoxon rank test). ○, outliers, n=7/group.

