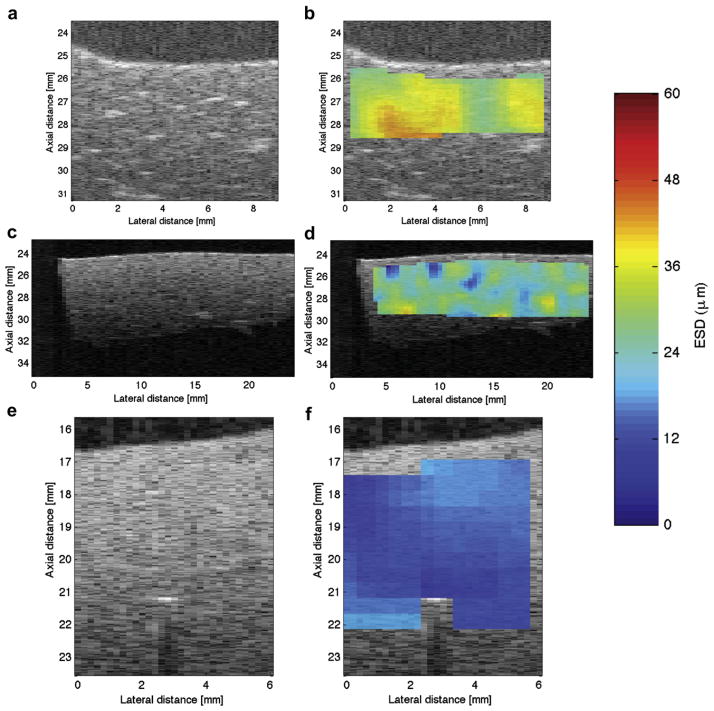
Fig. 7.
(a), (c), and (e) are the B-mode images of liver samples from animals that were on the normal diet, 3 weeks of the fatty diet, and 6 weeks of the fatty diet, respectively. Similarly, the subplots (b), (d), and (f) are the parametric images enhanced by ESD estimates from liver samples taken from animals that were on the normal diet, 3 weeks of the fatty diet, and 6 weeks of the fatty diet, respectively.

