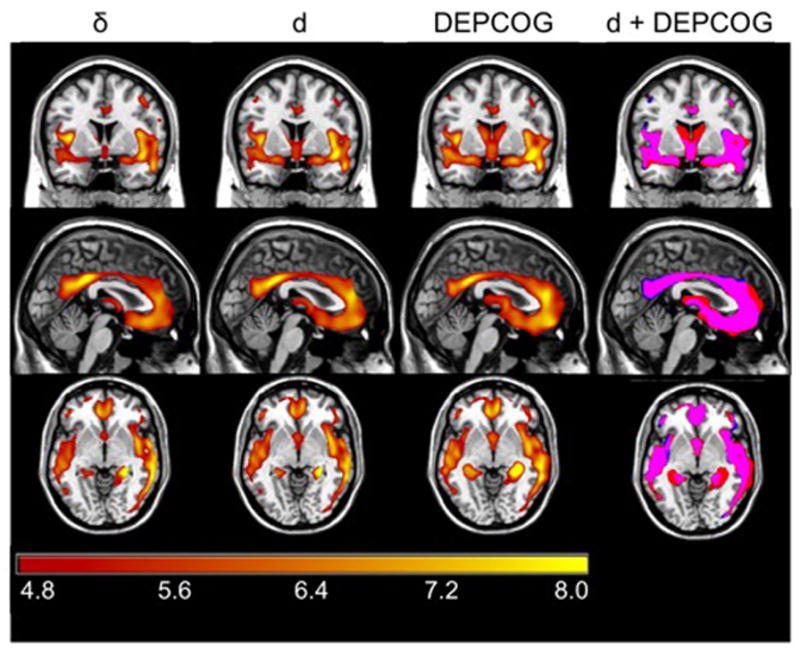
Figure 6.

Regional Cortical Atrophy Associated Specifically with DEPCOG. Figure 6 shows regional cortical volume associated with δ (left column), d (middle left column), and DEPCOG (middle right column). Each analysis is adjusted for age, gender and education (and implicitly for g′). The colorbar represents the voxel-wise T statistic, only significant voxels are presented (FWE>0.05, k>50). The overlap of the maps can be seen in right column: d is shown in blue, DEPCOG is in red and the overlap is shown in magenta. Adjusted for age and gender (and implicitly for education and g′). Note overlap with elements of the Default Mode Network.
