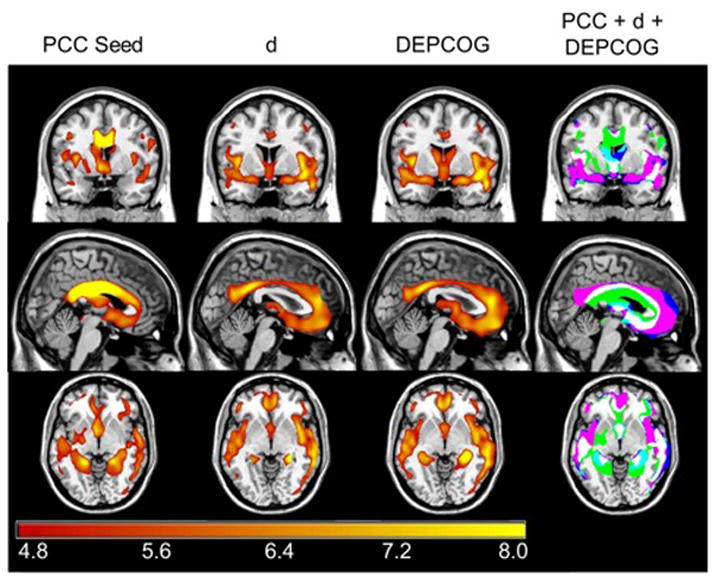
Figure 7.

A PCC seed Replicates d and DEPCOG. Adjusted for age and gender (and implicitly for education and g′). PCC = Posterior Cingulate. Figure 7 shows regional cortical volume associated with volume in the posterior cingulate (PCC seed, left column), d (middle left column), and DEPCOG (middle right column). The colorbar represents the voxel-wise T statistic, only significant voxels are presented (FWE>0.05, k>50). The overlap of the maps can be seen in right column: DEPCOG alone = blue; PCC alone = green; d+DEPCOG = magenta; PCC + DEPCOG = aqua; all three = white.
