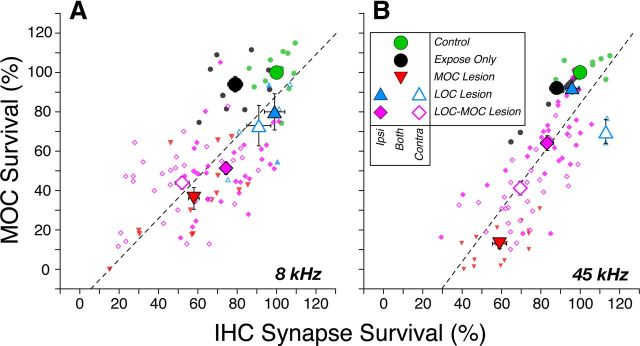
Figure 9.
The loss of IHC synapses is correlated with the loss of MOC innervation, in both the 8 kHz region (A) and the 45 kHz region (B), the apical and basal extremes where the neuropathy is greatest (Fig. 8). Large symbols are for group means; small symbols are for individual animals. Error bars indicate ± SEM. The percentage survival of MOC terminals is computed as described for Figure 3; the percentage survival of IHC synapses is computed as described for Figure 8. Dashed lines represent best fits to the scatterplots: slopes and y intercepts (x = 0) are 1.34 and −49.68, respectively, for A and 1.04 and −16.18, respectively, for B.

