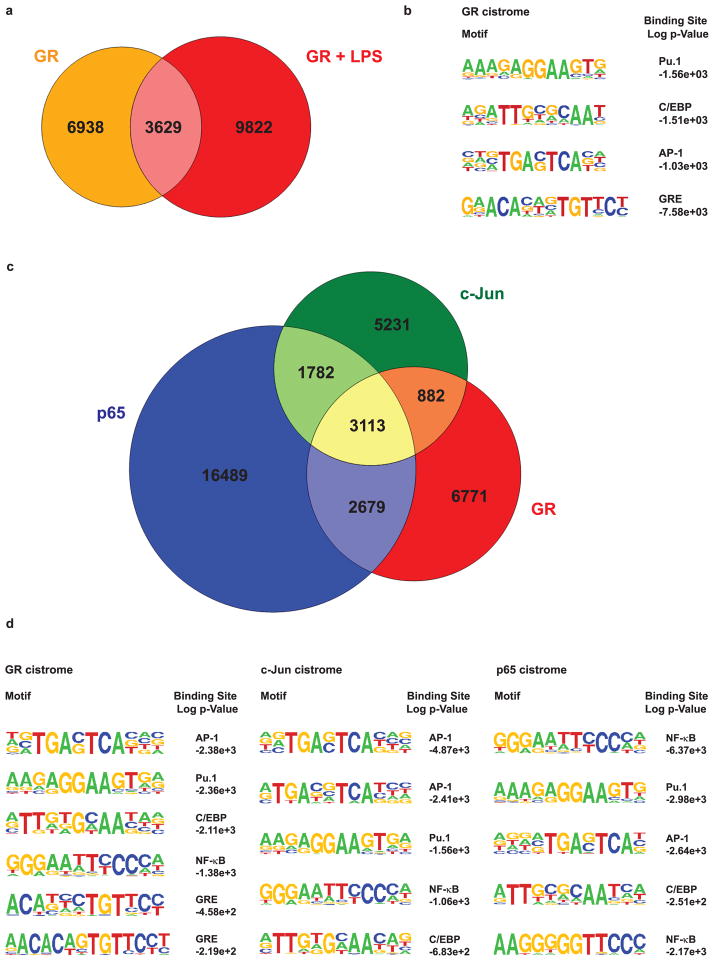
Figure 1. GR, AP-1 and NF-κB cistromes intersect.
a) Area-proportional Venn diagram of GR cistromes in unstimulated (orange) and stimulated (red) macrophages. b) Motif analysis of the GR cistrome in macrophages treated with Dex only. c) Area-proportional Venn diagram showing the overlap between GR, c-Jun and p65 ChIP-Seq peaks in macrophages treated with LPS and Dex. Genomic regions with significant peak scores were merged and given a 100bp margin for co-occurrence. d) Globally enriched motifs within the GR, c-Jun and p65 cistromes in response to LPS. Tables show the top five to six statistically overrepresented binding sites.

