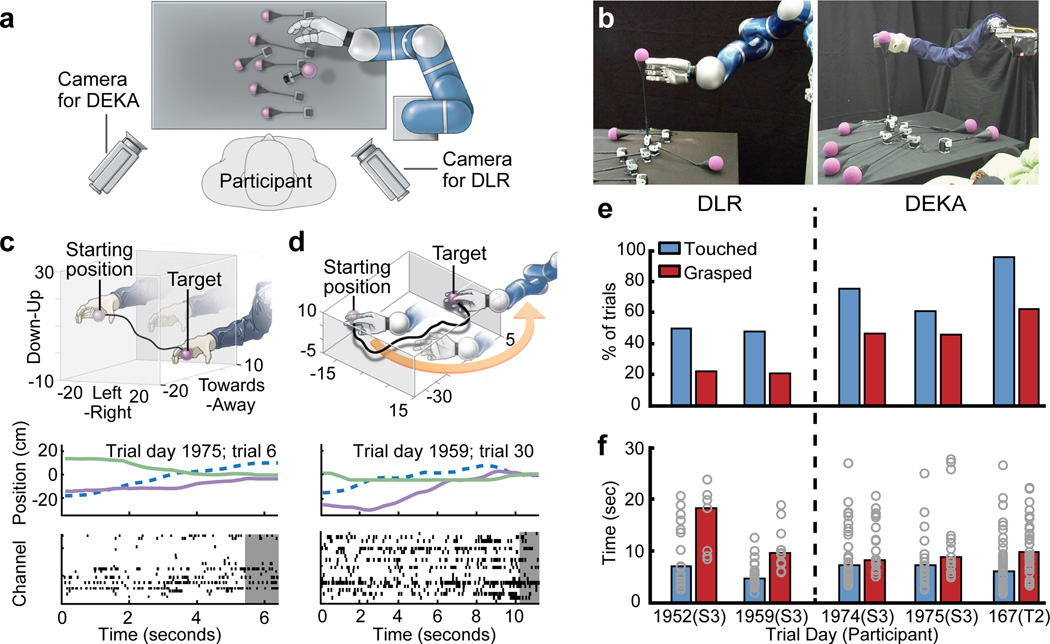
Figure 1.
Experimental setup and performance metrics. (a) Diagram showing an overhead view of participant’s location at the table (grey rectangle) from which the targets (purple spheres) were elevated by a motor. The robotic arm was positioned to the right and slightly in front of the participant (the DLR and DEKA arms were mounted in slightly different locations to maximize the correspondence of their workspaces over the table; for details, see Supplementary Fig. 9). Both video cameras were used for all DLR and DEKA sessions; labels indicate which camera was used for the photographs in (b). (b) Photographs of the DLR (left panel) and DEKA (right panel) robots. (c) Reconstruction of an example trial in which the participant moved the DEKA arm in all three dimensions to successfully reach and grasp a target. The top panel illustrates the trajectory of the hand in 3D space. The middle panel shows the position of the wrist joint for the same trajectory decomposed into each of its three dimensions relative to the participant: the left-to-right axis (dashed blue line), the near-to-far axis (purple line) and the up-down axis (green line). The bottom panel shows the threshold crossing events from all units that contributed to decoding the movement. Each row of tick marks represents the activity of one unit and each tick mark represents a threshold crossing. The grey shaded area shows the first 1 sec of the grasp. (d) An example trajectory from a DLR session in which the participant needed to move the robot hand, which started to the left of the target, around and to the right of the target in order to approach it with the open part of the hand. The middle and bottom panels are analogous to (c). (e) Percentage of trials in which the participant successfully touched the target with the robotic hand (blue bars) and successfully grasped the target (red bars). (f) Average time required to touch (blue bars) or grasp (red bars) the targets. Each circle shows the acquisition time for one successful trial.

