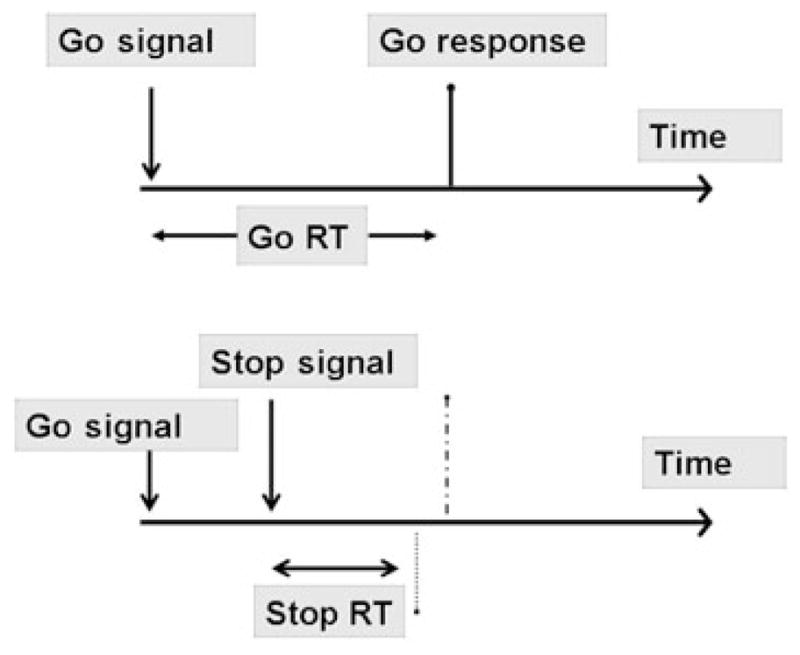
Figure 3.

Schematic of the Stop Task procedure. Subjects are presented with either Go trials (75% of trials; top panel) or Stop trials (25% of trials; bottom panel). A simple Go reaction time is calculated from the Go trials. On Stop trials, subject is give a Stop signal shortly after the Go signal, and instructed to inhibit their ‘Go’ response on these trials. The time between the Go and Stop signal is varied systematically until the delay is reached at which the subject is able to inhibit the response on 50% of trials. This provides an estimate of the time needed to stop a response. Longer stop times are indices of poorer inhibitory control
