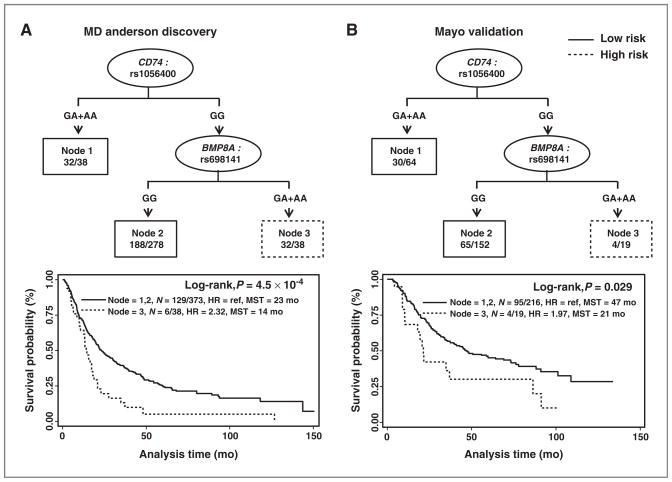
Figure 2.
Potential gene–gene interactions among SNPs validated in the survival tree analysis. A, survival tree analysis results and Kaplan–Meier estimates in the MD Anderson population (discovery phase). B, survival tree analysis results and Kaplan–Meier estimates in the Mayo Clinic population (validation phase). MST, median survival time in months. N = A/B, A: number of patients with event, B: total number of patients.

