
Figure 1.
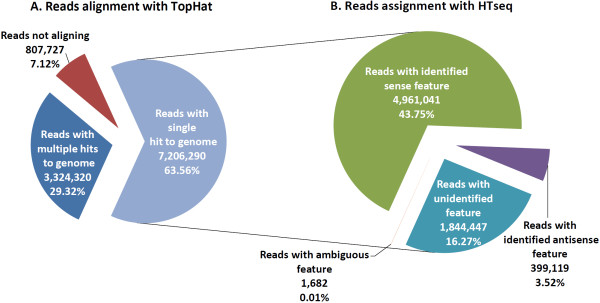
Apportionment of reads mapping to unique and multiple locations in the B. taurus reference genome. A) Pie chart showing the mean number and percentage of reads that aligned to unique location and multiple locations in the B. taurus reference genome using the TopHat splice junction mapper. B) Pie chart showing the mean number and percentage of uniquely mapped reads assigned to ambiguous gene features (i.e. reads that map to overlapping gene sequences), unidentified gene features (i.e. reads that map to the genome that have no gene annotation) and identified features (i.e. known gene sequences) based on sense strand and antisense strand data using the HTSeq package.