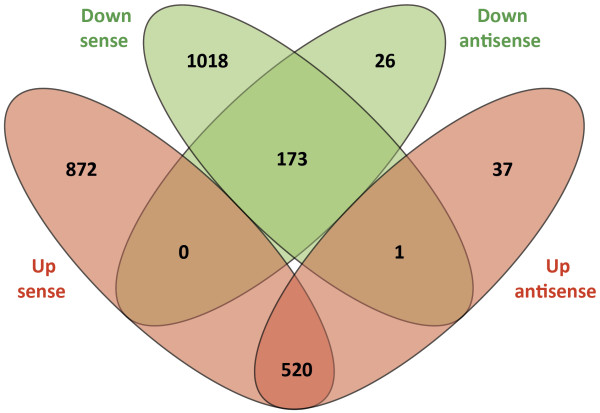
Figure 5.
Venn diagrams showing comparison of RNA-seq sense versus antisense strand differential gene expression. Venn diagram showing the comparison of the direction of differential expression based on sense and antisense strand data. Upregulated and downregulated genes are shaded red and green, respectively.

