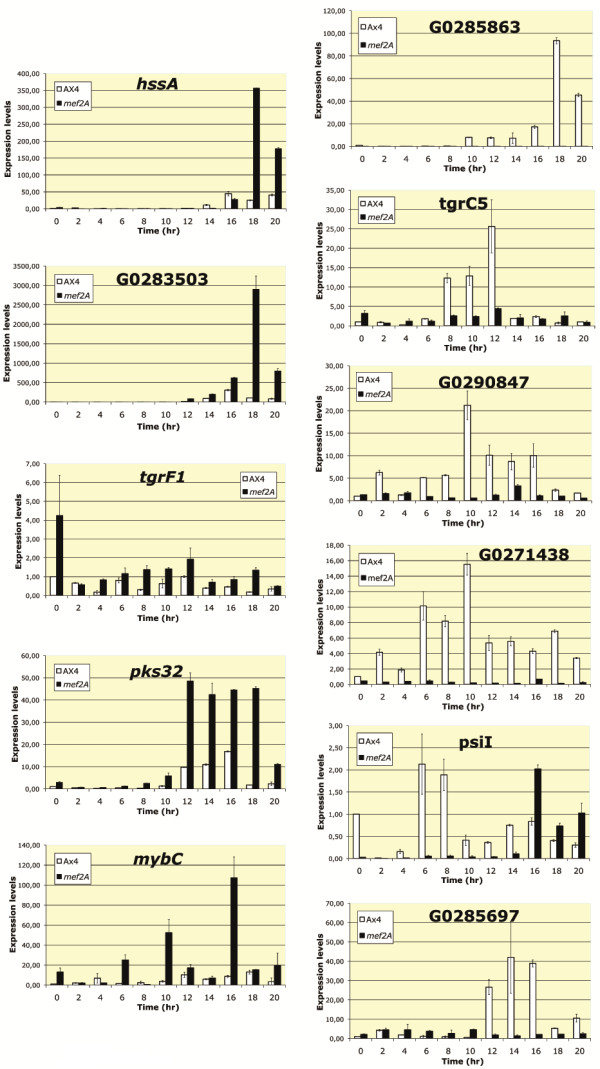
Figure 7.

Developmental expression pattern of representative genes differentially regulated in wild-type and mef2A-mutant structures, as determined by mRNA sequencing. RNA was isolated from wild-type (AX4) or mef2A- mutant (mef2A) cells during growth (time 0) or from structures developed for the indicated times on nitrocellulose filters (2–20 hours). RNAs were converted into cDNA, and the expression level of each gene was determined by quantitative PCR. A fragment of the large mitochondrial ribosomal RNA was used as an internal control for expression quantification. The relative value of 1 was assigned to the expression level of growing wild-type cells for each gene. Open bars correspond to the wild-type expression levels and black bars to the mef2A- mutant expression levels. Panels on the left correspond to genes that were expressed at the highest levels in mef2A- mutant structures, according to the mRNA sequencing analyses, and the panels on the right correspond to genes that were expressed at higher levels in wild-type cells. Two biological replicates and three technical replicates of each sample were analyzed. Error bars represent the standard deviation of the data.
