Figure 3.

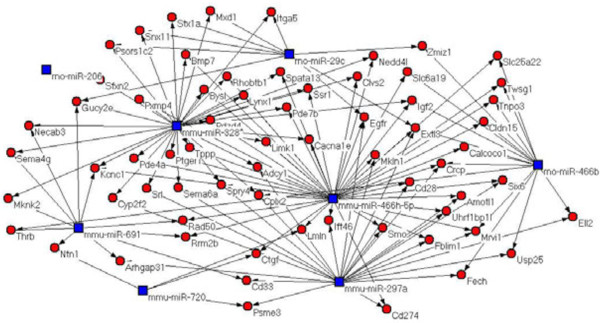
microRNA-target-network. Red cycle nodes represent mRNA and blue box nodes represent miRNA. Significant miRNAs differentially expressed in different tissues of rat. Edges represent the inhibitive effect of microRNA on mRNA.

microRNA-target-network. Red cycle nodes represent mRNA and blue box nodes represent miRNA. Significant miRNAs differentially expressed in different tissues of rat. Edges represent the inhibitive effect of microRNA on mRNA.