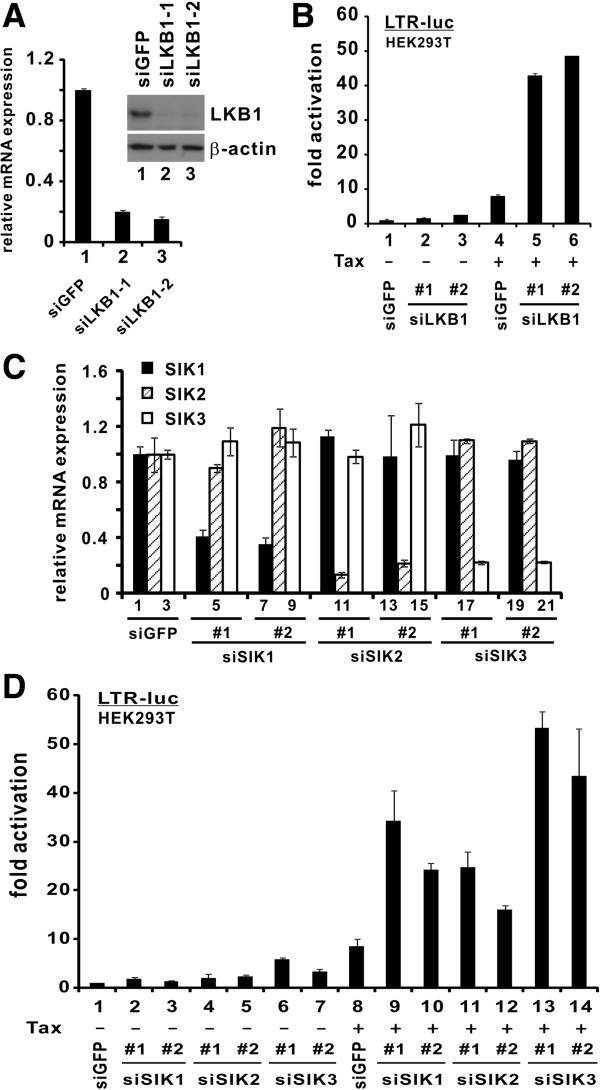
Figure 3.
Silencing of LKB1 and SIKs facilitates Tax activation of LTR. (A) Verification of LKB1 knockdown. RT-qPCR was performed to analyze LKB1 and GAPDH transcripts. Quantitation of mRNA expression was achieved by comparative Ct method. Relative LKB1 mRNA expression in siGFP-transfected cells was taken as 1. Endogenous LKB1 in siRNA-transfected HEK293T cells was also analyzed by Western blotting at 72 hr post-transfection (inset). Two independent LKB1-targeting siRNAs (siLKB1-1 and siLKB1-2) at a concentration of 100 nM were used to deplete endogenous LKB1. siGFP was used as a negative control. Statistically significant differences exist between groups 1 and 2 or 1 and 3 (p = 0.0000033 or 0.0000073 by two tailed Student’s t test). (B) Downregulation of endogenous LKB1 augmented Tax activation of LTR. After 36 hrs of knockdown, plasmids pLTR-Luc, pSV-RLuc and pIEX were cotransfected into HEK293T cells. The difference between groups 4 and 5 or 4 and 6 is statistically significant (p = 0.0045 or 0.0080). (C) Verification of SIK knockdown by siRNAs. RT-qPCR was performed as in A. p values for selected bars were calculated (1 and 4: 0.00020; 1 and 7: 0.00013; 2 and 11: 0.00027; 2 and 14: 0.00042; 3 and 18: 0.0000046; 3 and 21: 0.00012). (D) Downregulation of individual endogenous SIK augmented Tax activity. Two independent siRNAs at a concentration of 100 nM were used to deplete endogenous SIKs in HEK293T cells. siGFP was used as a negative control. After 36 hrs of knockdown, plasmids pLTR-Luc, pSV-RLuc and pIEX were cotransfected into cells. Cells were harvested 36 hrs after the second transfection. Statistically significant differences exist between group 8 and each of groups 9–14 (p = 0.027, p = 0.001, p = 0.030, p = 0.0051, p = 0.0034 and p = 0.037, respectively).

