Figure 1.
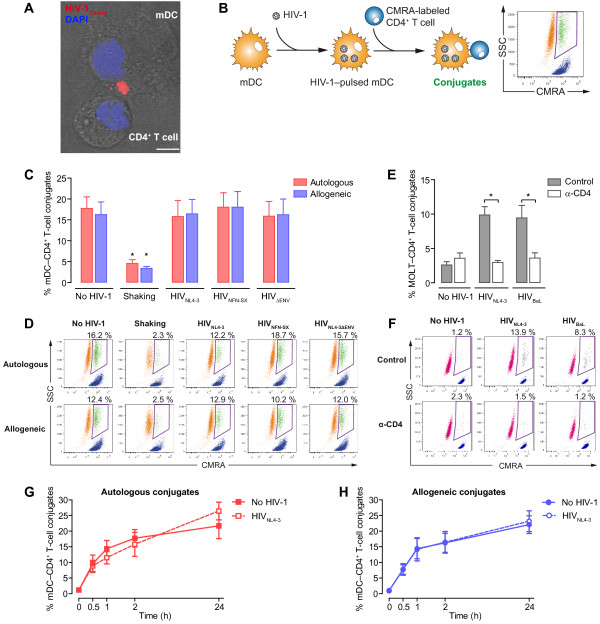
Conjugate formation between mDC harboring HIV-1 and primary CD4+ T cells is independent of the presence of HIV-1. A. Confocal microscopy analysis of a HIV-1-pulsed mDC-CD4+ T-cell synapse, showing the polarization of the HIV-1-containing intracellular compartment in mDC to the contact zone. Merge of the bright field and the fluorescence of an x-y plane (scale bar: 5 μm). B. Experimental procedure for quantification of cellular conjugates between mDC and CMRA-labeled CD4+ T cells by flow cytometry. Events with similar morphology to mDC (SSC) but simultaneously positive for the CMRA were considered stable cellular conjugates between mDC and primary CD4+ T cells (green). Events corresponding to mDC are in orange, and CMRA-labeled CD4+ T cells are in blue. C. Comparative quantification of cellular conjugates between mDC and non-activated primary CD4+ T cells in the presence or absence of HIV-1 after 2 hours of autologous (red) or allogeneic (blue) co-culture. D. Representative experiment of quantification of cellular conjugates between mDC preloaded with different HIV-1 strains and non-activated CMRA-labeled CD4+ T cells by flow cytometry; cellular conjugates (green), mDC (orange), and CMRA-labeled CD4+ T cells (blue). E. Comparative quantification of cellular conjugates between MOLT cell lines chronically infected with X4- (MOLTNL4-3) or R5-tropic (MOLTBaL) HIV-1 and non-activated primary CD4+ T cells after 2 hours of co-culture. F. Representative experiment of quantification of cellular conjugates between HIV-1-infected MOLT cells and non-activated CMRA-labeled CD4+ T cells by flow cytometry; cellular conjugates (black), MOLT cells (red), and CMRA-labeled CD4+ T (blue). G. and H. Kinetics of conjugate formation in autologous (G) or allogeneic (H) mDC-CD4+ T-cell co-cultures in the presence or absence of HIV-1. Asterisks indicate significant differences compared with co-cultures in the absence of HIV-1 (p < 0.05). Data are expressed as mean and SEM from three independent experiments including cells from six different donors.

