
Figure 1.
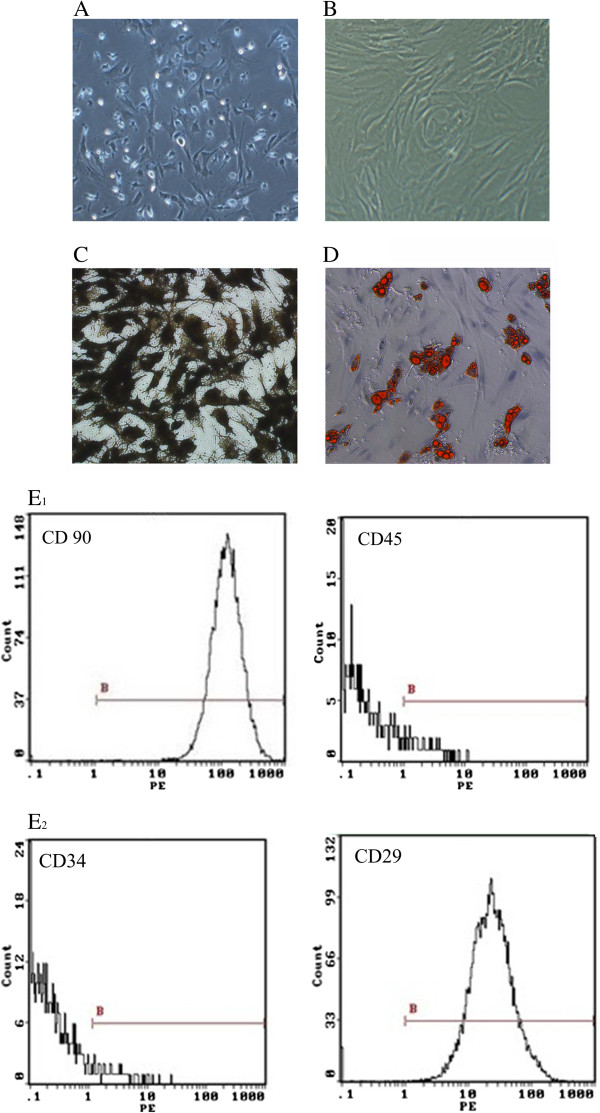
BMSC morphology and surface marker expression. BMSC morphology and differentiation was assessed by microscopy of BMSCs (A) in the first passage, (B) third passage, (C) after Von Kossa staining for visualization of osteoblasts after induction, (D) and after Oil red staining for adipocytes after induction (200×). (E) CD90, CD45, CD34, and Cd29 surface market expression was determined using flow cytometry.