
Figure 4.
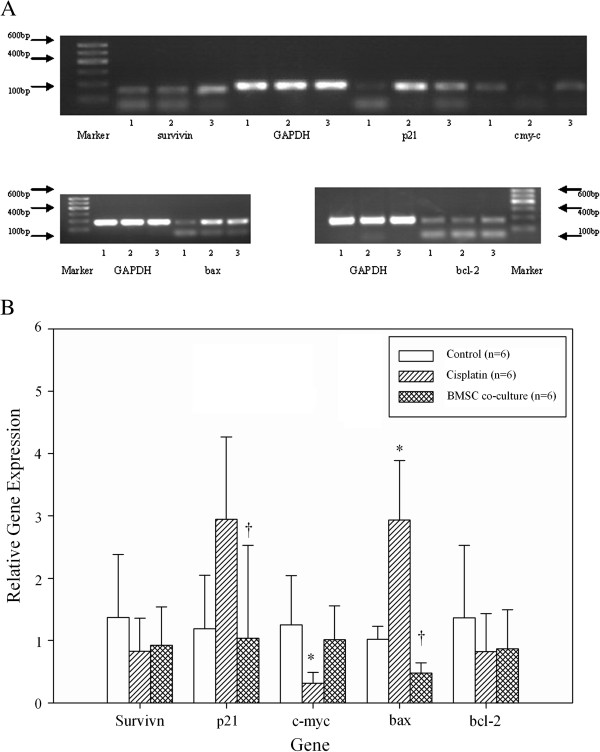
Effects of BMSCs on apoptosis-related genes in GCs. Relative gene expression levels were determined using real-time PCR among the control (lanes 1), cisplatin (lanes 2), and BMSC co-culture (lanes 3) groups. (A) Representative images for each gene analyzed were shown. (B) Relative gene expressions levels by using real-time PCR. * indicates a significant difference from the control group; P < 0.05, † indicates a significant difference from the cisplatin group; P < 0.05. N = 6 for each group.