
Figure 5.
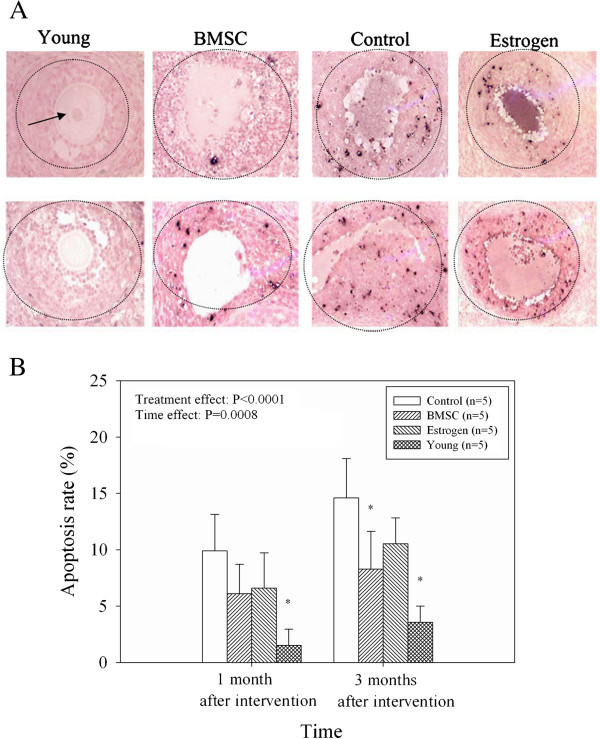
Effects of BMSCs in an in vivo model of perimenopause. GC apoptosis was assessed by TUNEL staining. (A) Representative images of ovarian tissues obtained from the young, BMSC, control, and estrogen groups one (top panels) and three (bottom panels) months after the intervention are shown (200×). (B) GC apoptosis rates among the control, BMSC, estrogen, and young groups after 1 and 3 months intervention. Values are presented as mean ± SD. * indicates a significant difference from control; P < 0.05 (Two-way ANOVA: treatment effect, P < 0.0001; time effect, P = 0.0008). N = 5 for each group.