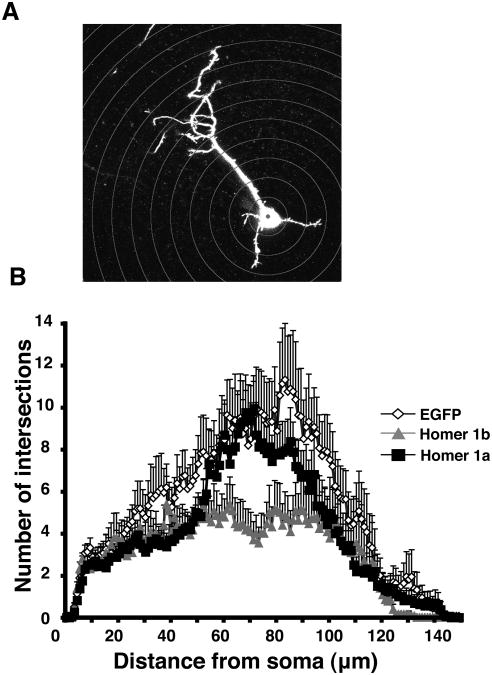
Figure 4.
Sholl analysis of cells expressing EGFP, Homer1b, and Homer 1a. (A) The Sholl analysis displays the complexity of the dendritic arbor from the cell soma to the most distal branches by counting the number of intersections the dendrites make with the concentric spheres. (B) Sholl analysis for cells transfected with EGFP, Homer 1b or Homer 1a (n = 16 cells in each condition).

