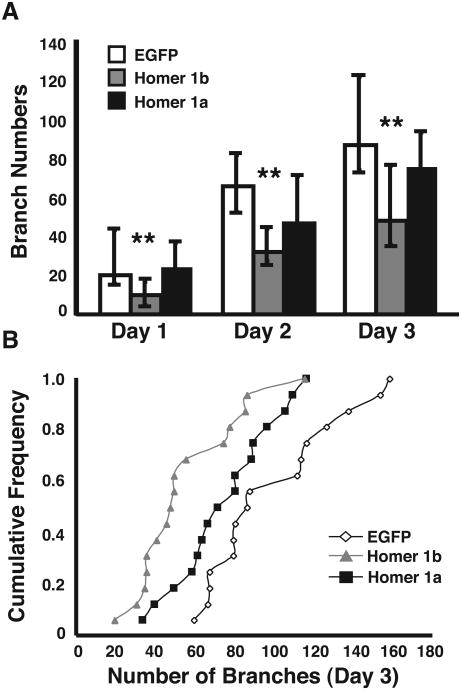
Figure 6.
Total number of dendritic branches in cells transfected with EGFP, Homer 1b, or Homer 1a. (A) Medians and IQR are plotted for branch numbers at each day of the 3-day imaging protocol. (B) Cumulative frequency plot of the dendritic branch numbers for each cell on the third day of imaging. (n = 16 cells in each condition).

